Supplementary figures
1 Traits with negative desired gains
1.1 AWNCF
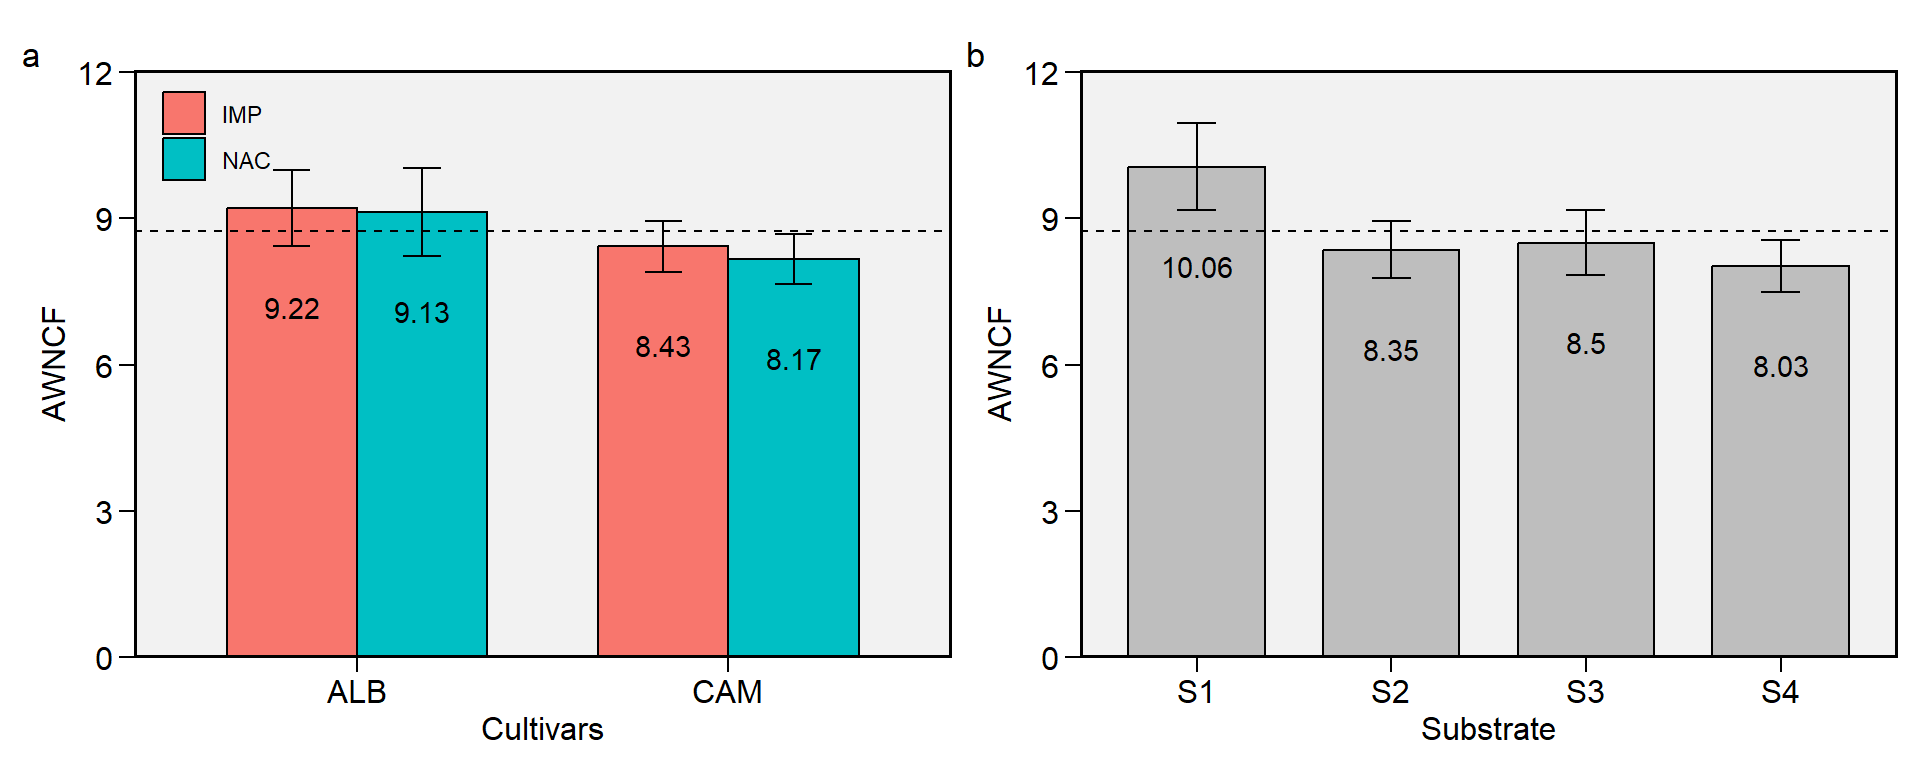
Figure 1.1: Average weight of non-commercial fruits. a: Cultivar (ALB: Albion; CAM: Camarosa) x origin (NAC: National; IMP: Imported) interaction; b: substrate main effect (S1: Sugarcane bagasse + organic compost; S2: Sugarcane bagasse + commercial substrate; S3: Rice husk + organic compost; and S4: Rice husk + commercial substrate). The horizonal dashed line shows the overall mean. Bars shows the mean +- standard error. N = 16.
1.2 NDBF
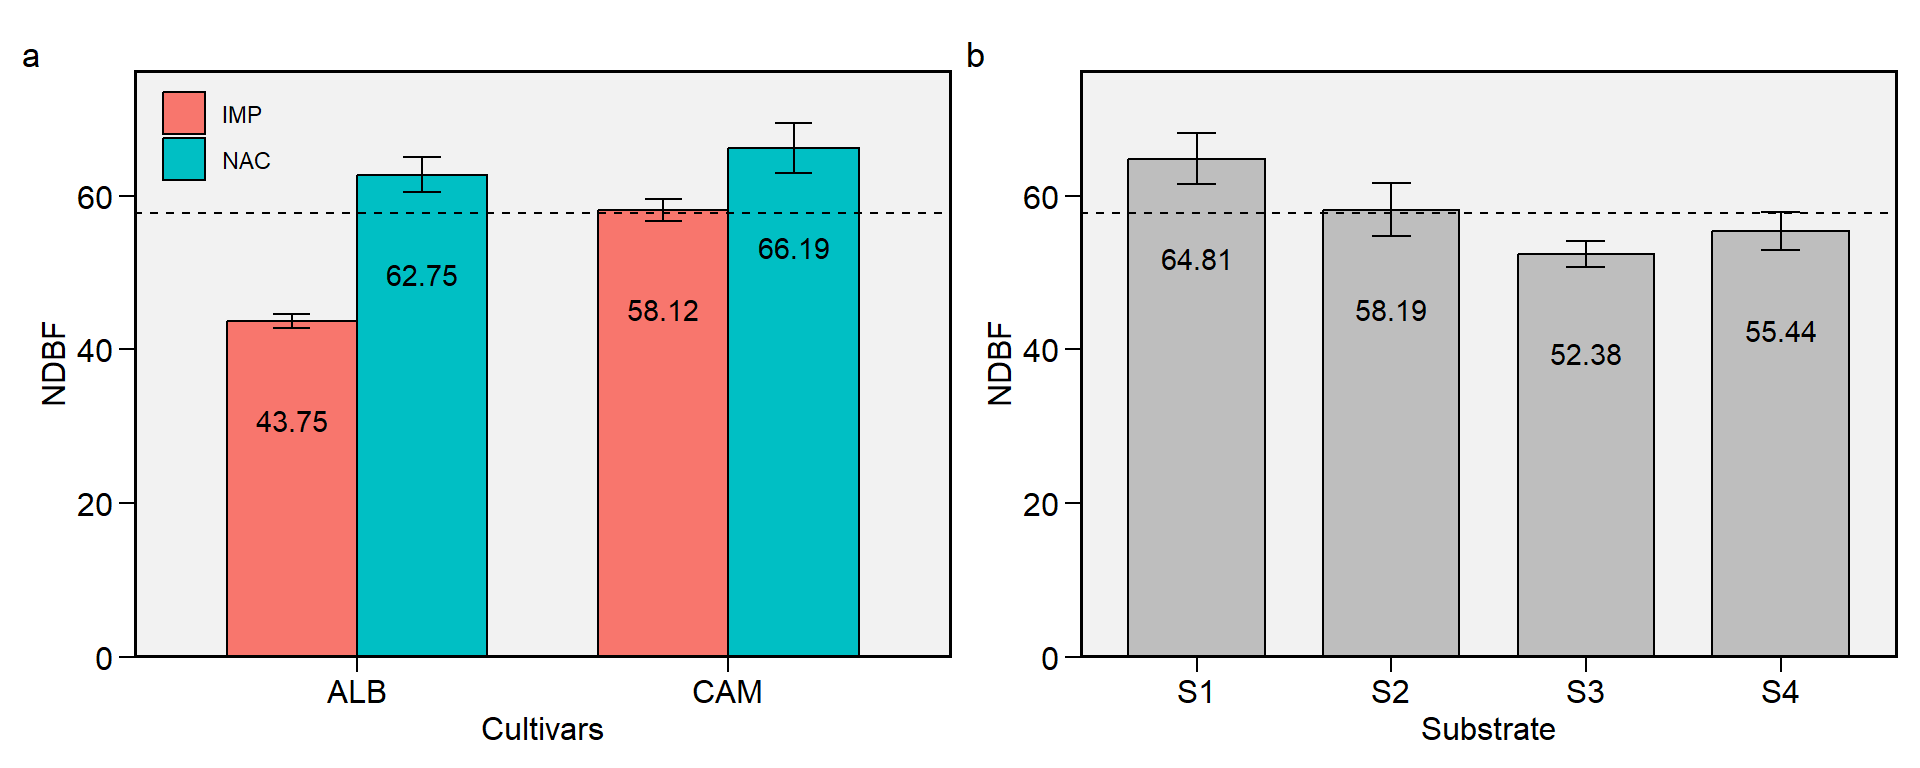
Figure 1.2: Begin of floration (days). a: Cultivar (ALB: Albion; CAM: Camarosa) x origin (NAC: National; IMP: Imported) interaction; b: substrate main effect (S1: Sugarcane bagasse + organic compost; S2: Sugarcane bagasse + commercial substrate; S3: Rice husk + organic compost; and S4: Rice husk + commercial substrate). The horizonal dashed line shows the overall mean. Bars shows the mean +- standard error. N = 16.
1.3 NDFF
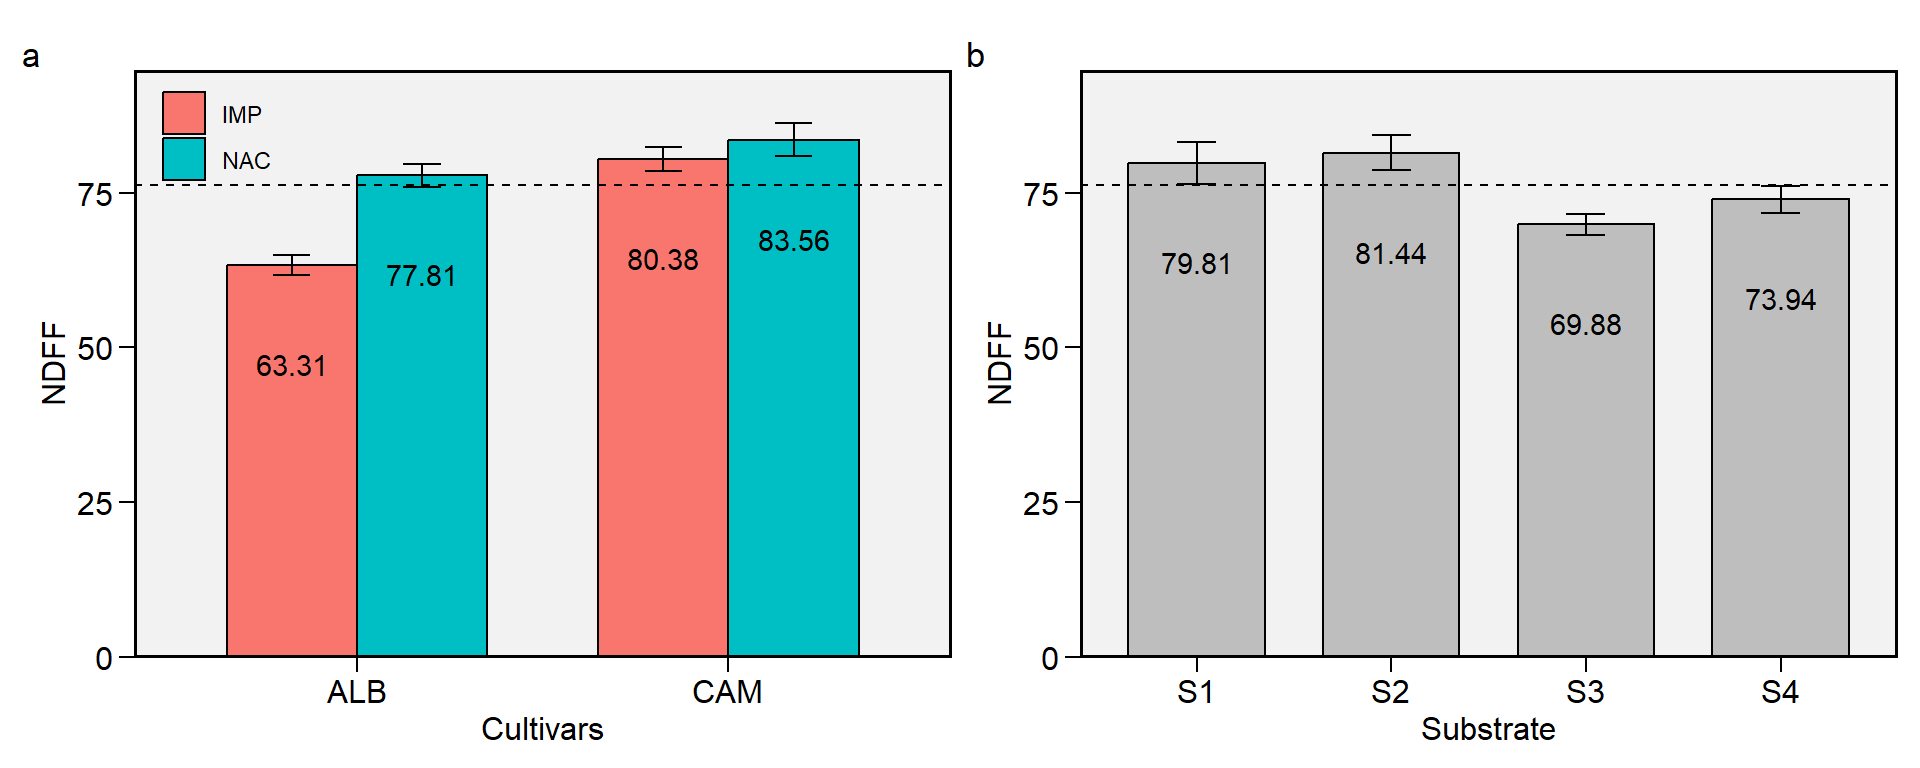
Figure 1.3: Plene floration (days). a: Cultivar (ALB: Albion; CAM: Camarosa) x origin (NAC: National; IMP: Imported) interaction; b: substrate main effect (S1: Sugarcane bagasse + organic compost; S2: Sugarcane bagasse + commercial substrate; S3: Rice husk + organic compost; and S4: Rice husk + commercial substrate). The horizonal dashed line shows the overall mean. Bars shows the mean +- standard error. N = 16.
1.4 NDBH

Figure 1.4: Begin of harvest (days). a: Cultivar (ALB: Albion; CAM: Camarosa) x origin (NAC: National; IMP: Imported) interaction; b: substrate main effect (S1: Sugarcane bagasse + organic compost; S2: Sugarcane bagasse + commercial substrate; S3: Rice husk + organic compost; and S4: Rice husk + commercial substrate). The horizonal dashed line shows the overall mean. Bars shows the mean +- standard error. N = 16.
1.5 NNCF
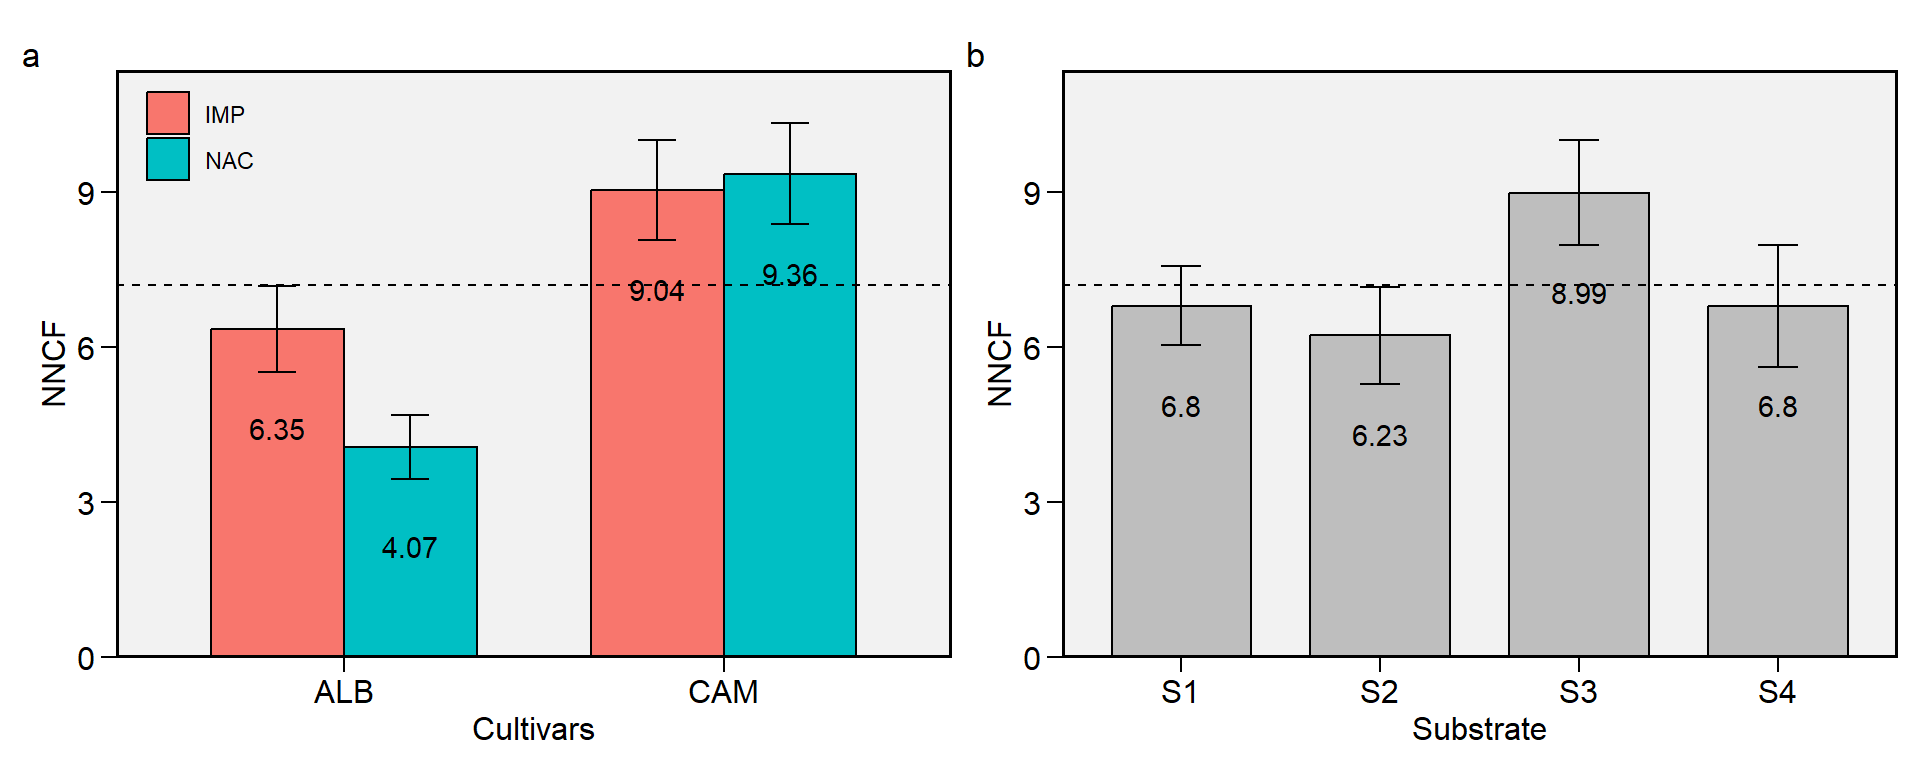
Figure 1.5: Number of non-commercial fruits. a: Cultivar (ALB: Albion; CAM: Camarosa) x origin (NAC: National; IMP: Imported) interaction; b: substrate main effect (S1: Sugarcane bagasse + organic compost; S2: Sugarcane bagasse + commercial substrate; S3: Rice husk + organic compost; and S4: Rice husk + commercial substrate). The horizonal dashed line shows the overall mean. Bars shows the mean +- standard error. N = 16.
1.6 PHYL
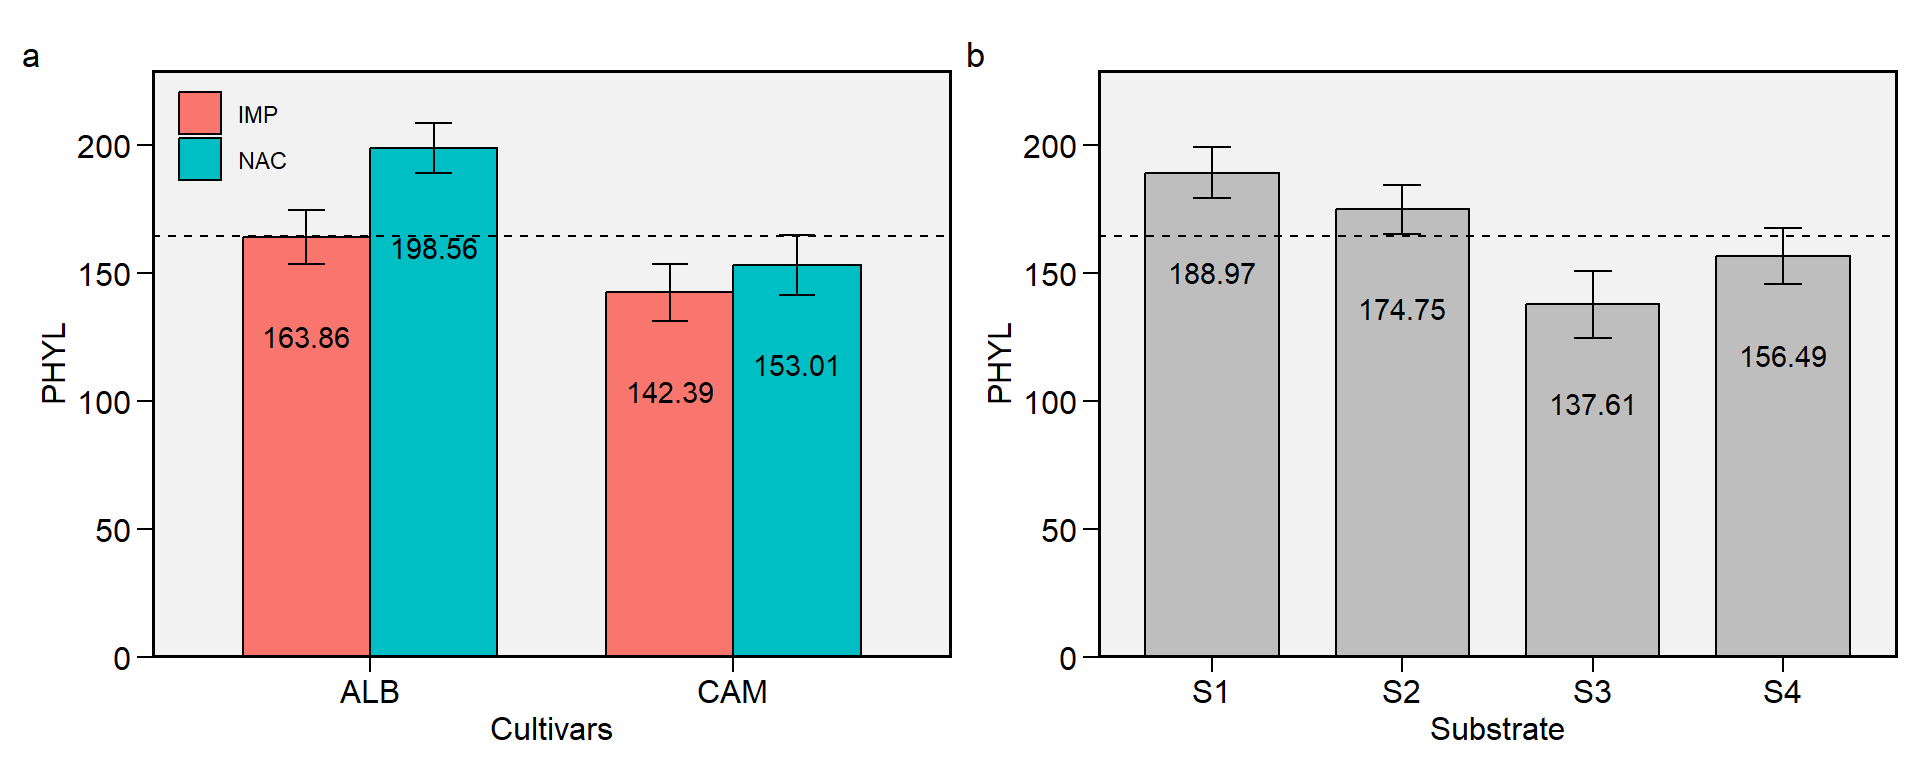
Figure 1.6: Phyllochron. a: Cultivar (ALB: Albion; CAM: Camarosa) x origin (NAC: National; IMP: Imported) interaction; b: substrate main effect (S1: Sugarcane bagasse + organic compost; S2: Sugarcane bagasse + commercial substrate; S3: Rice husk + organic compost; and S4: Rice husk + commercial substrate). The horizonal dashed line shows the overall mean. Bars shows the mean +- standard error. N = 16.
1.7 TA
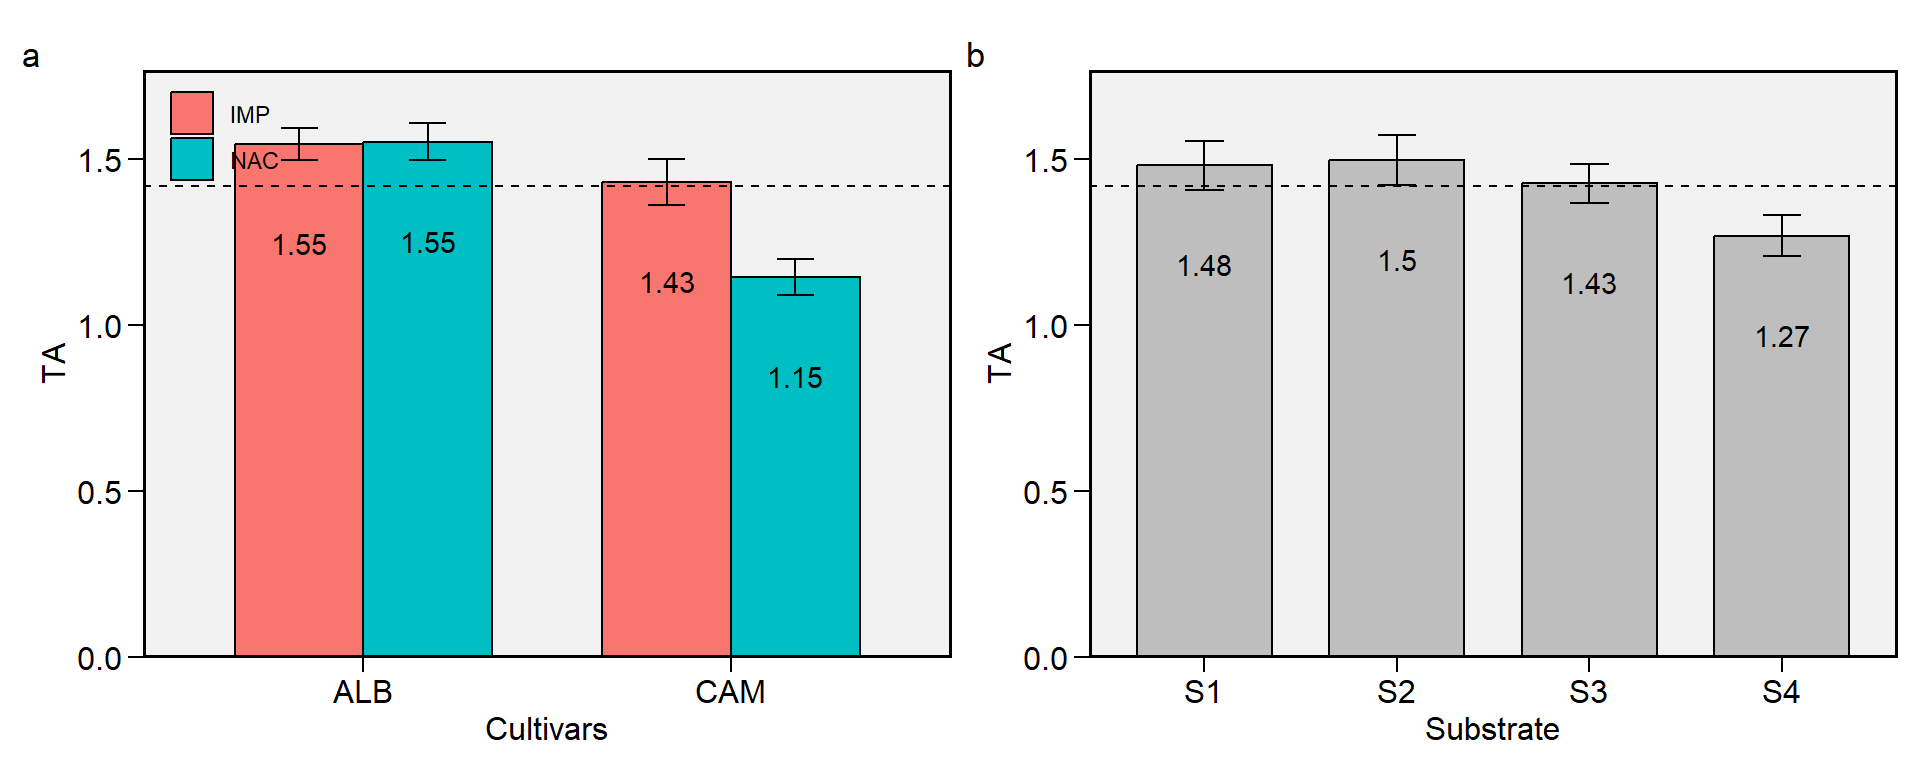
Figure 1.7: Total acid. a: Cultivar (ALB: Albion; CAM: Camarosa) x origin (NAC: National; IMP: Imported) interaction; b: substrate main effect (S1: Sugarcane bagasse + organic compost; S2: Sugarcane bagasse + commercial substrate; S3: Rice husk + organic compost; and S4: Rice husk + commercial substrate). The horizonal dashed line shows the overall mean. Bars shows the mean +- standard error. N = 16.
1.8 WNCF
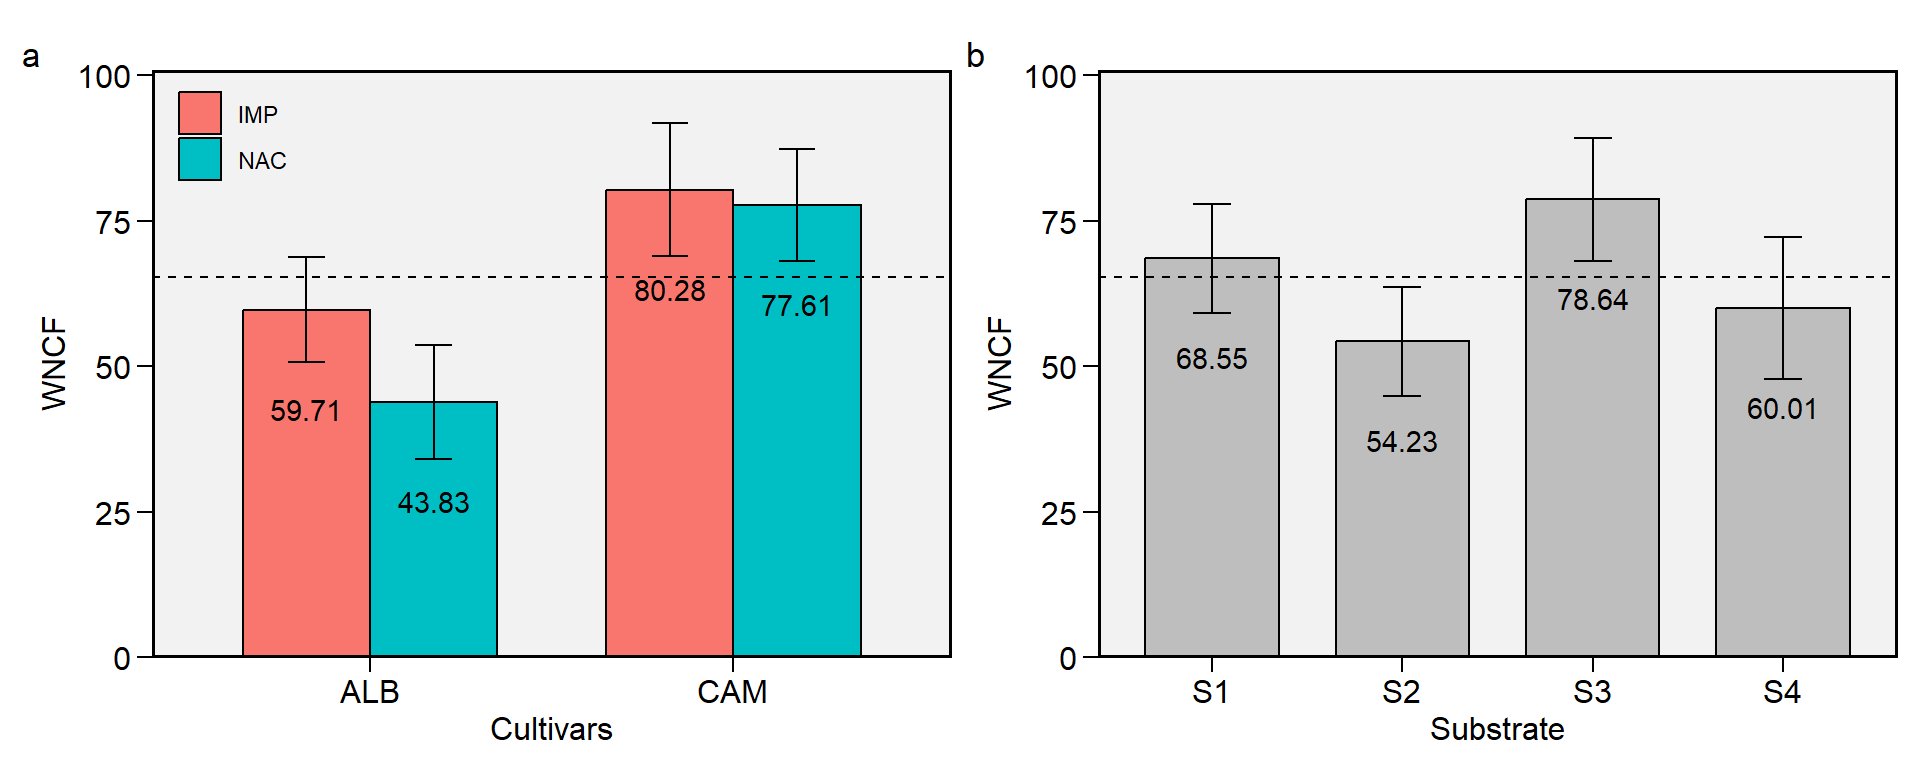
Figure 1.8: Weight of non-commercial fruits. a: Cultivar (ALB: Albion; CAM: Camarosa) x origin (NAC: National; IMP: Imported) interaction; b: substrate main effect (S1: Sugarcane bagasse + organic compost; S2: Sugarcane bagasse + commercial substrate; S3: Rice husk + organic compost; and S4: Rice husk + commercial substrate). The horizonal dashed line shows the overall mean. Bars shows the mean +- standard error. N = 16.
1.9 WUE
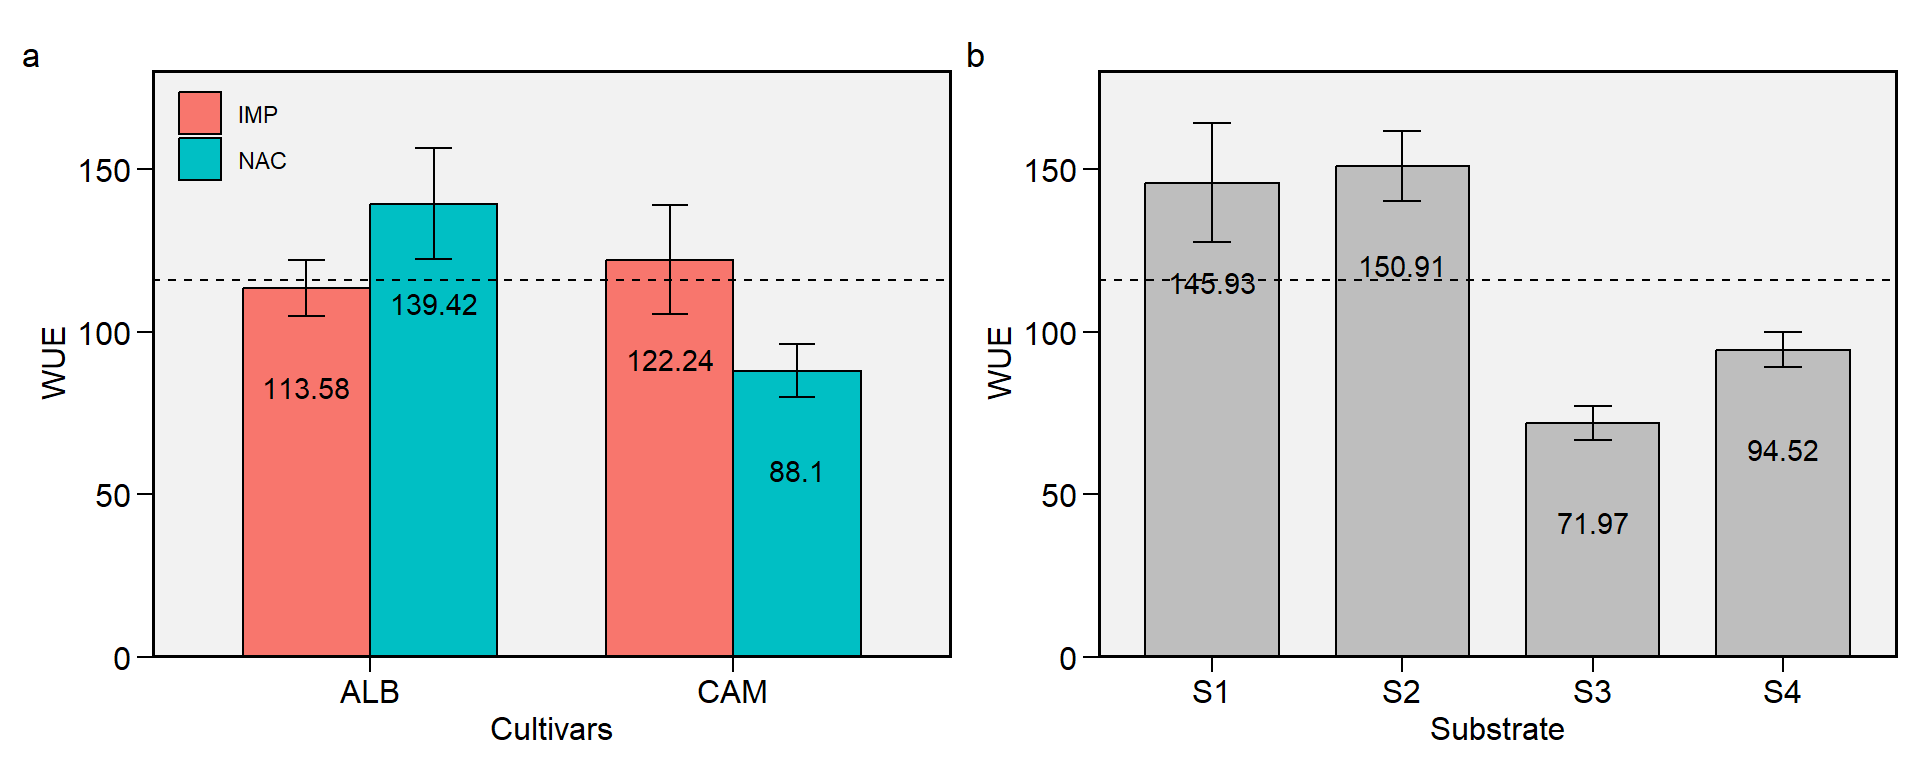
Figure 1.9: Water use efficiency. a: Cultivar (ALB: Albion; CAM: Camarosa) x origin (NAC: National; IMP: Imported) interaction; b: substrate main effect (S1: Sugarcane bagasse + organic compost; S2: Sugarcane bagasse + commercial substrate; S3: Rice husk + organic compost; and S4: Rice husk + commercial substrate). The horizonal dashed line shows the overall mean. Bars shows the mean +- standard error. N = 16.
2 Traits with positive desired gains
2.1 AWCF
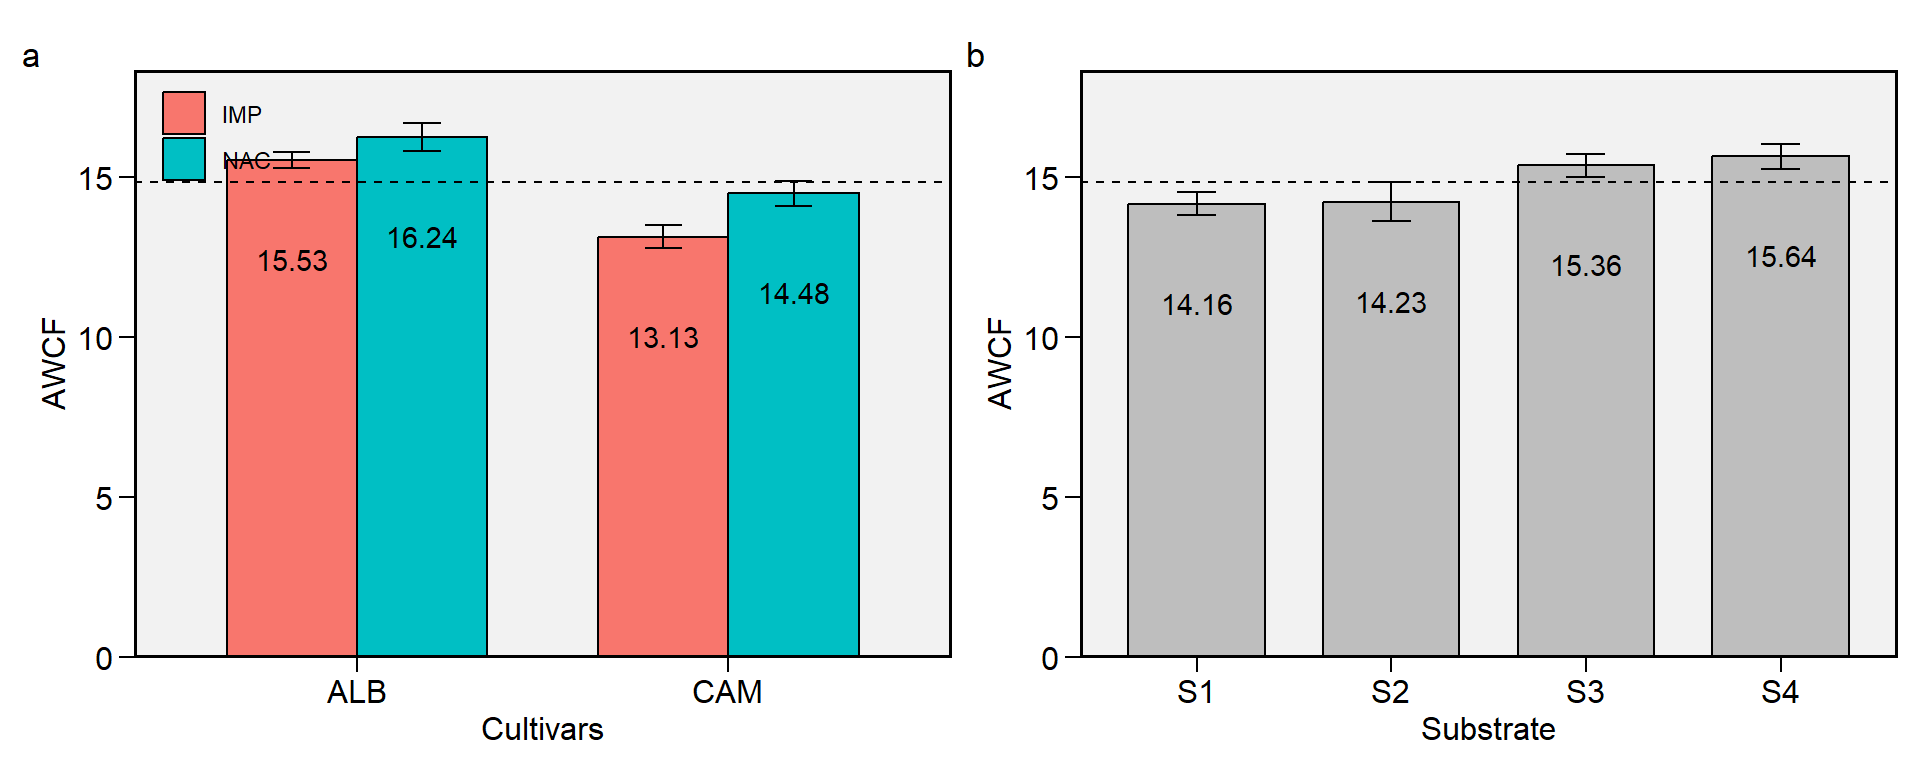
Figure 2.1: Average weigth of comercial fruits. a: Cultivar (ALB: Albion; CAM: Camarosa) x origin (NAC: National; IMP: Imported) interaction; b: substrate main effect (S1: Sugarcane bagasse + organic compost; S2: Sugarcane bagasse + commercial substrate; S3: Rice husk + organic compost; and S4: Rice husk + commercial substrate). The horizonal dashed line shows the overall mean. Bars shows the mean +- standard error. N = 16.
2.2 CHROMA
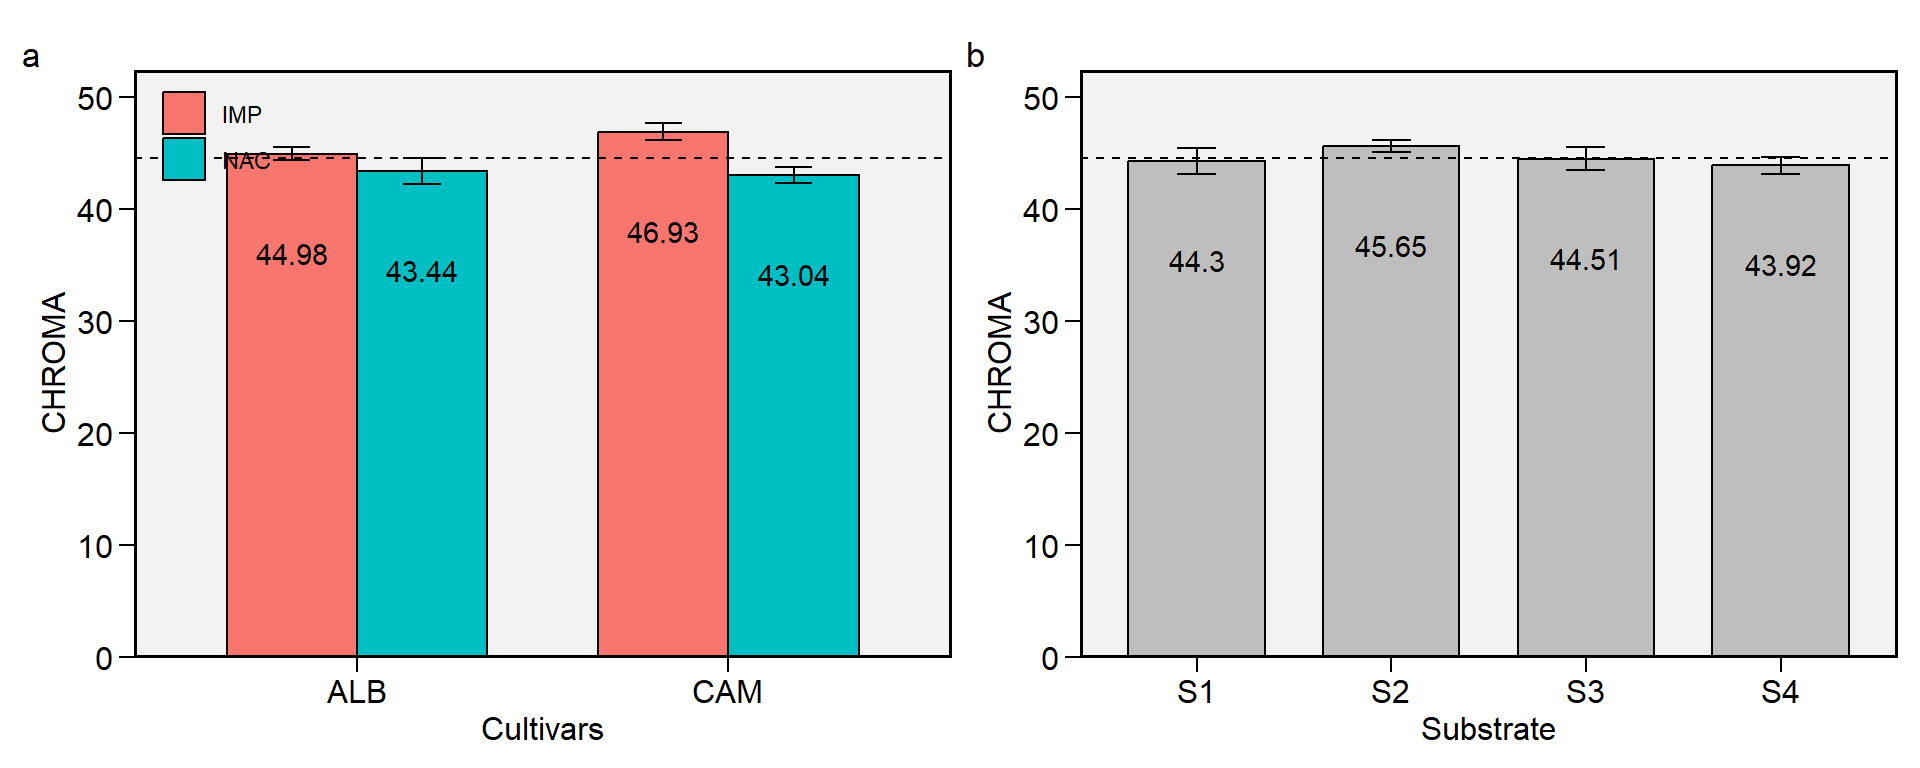
Figure 2.2: CHROMA. a: Cultivar (ALB: Albion; CAM: Camarosa) x origin (NAC: National; IMP: Imported) interaction; b: substrate main effect (S1: Sugarcane bagasse + organic compost; S2: Sugarcane bagasse + commercial substrate; S3: Rice husk + organic compost; and S4: Rice husk + commercial substrate). The horizonal dashed line shows the overall mean. Bars shows the mean +- standard error. N = 16.
2.3 FIRM
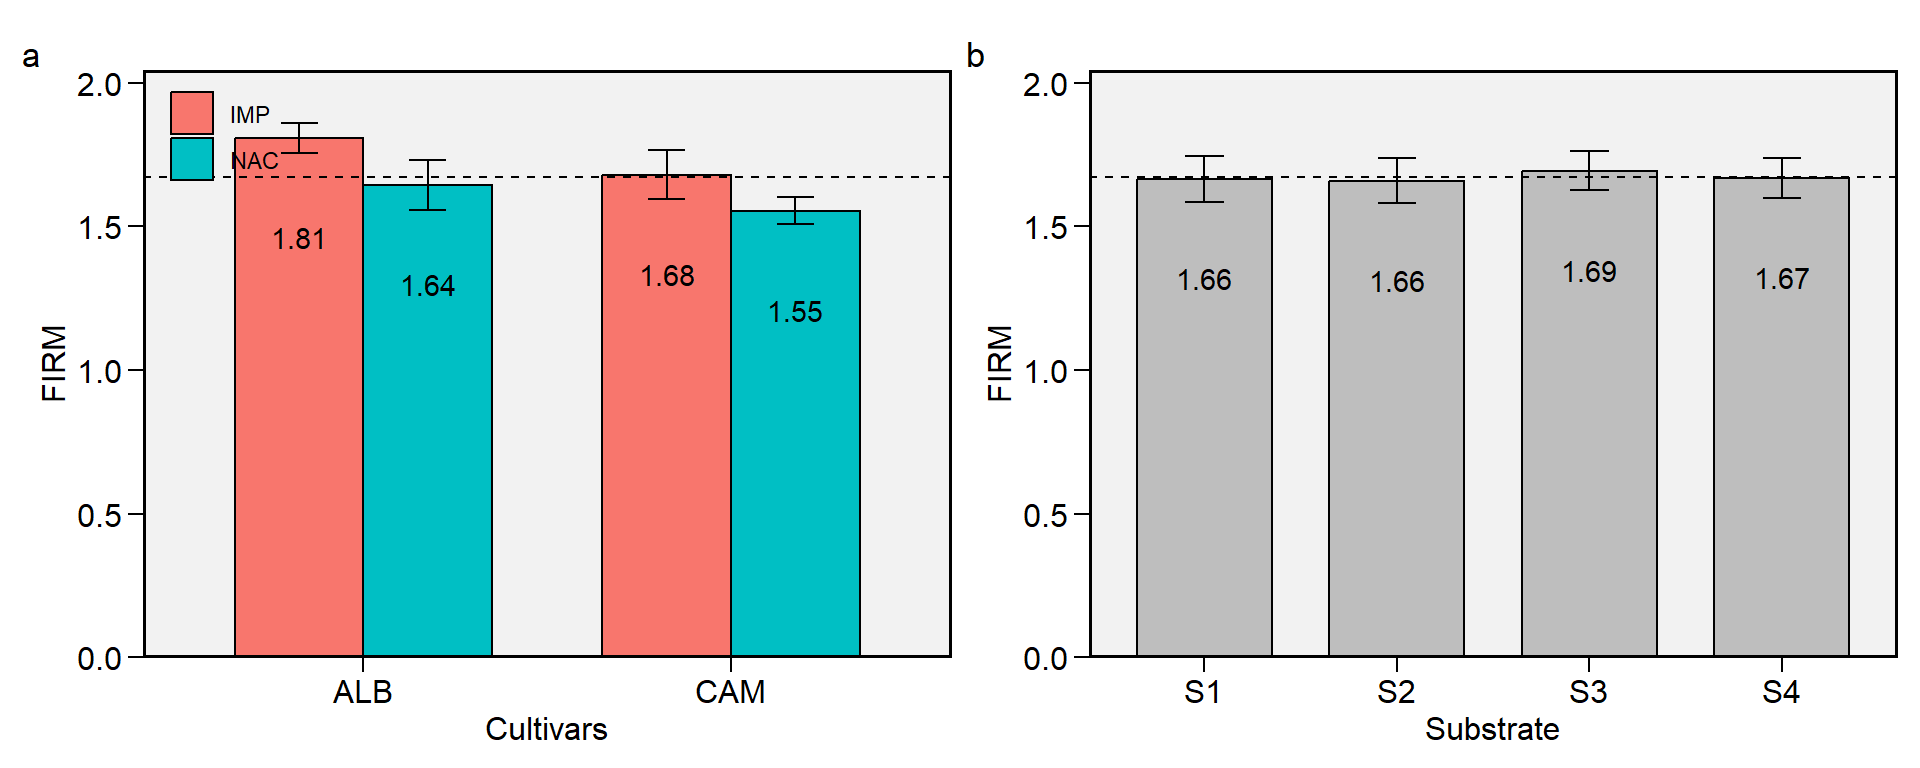
Figure 2.3: Flesh firmness. a: Cultivar (ALB: Albion; CAM: Camarosa) x origin (NAC: National; IMP: Imported) interaction; b: substrate main effect (S1: Sugarcane bagasse + organic compost; S2: Sugarcane bagasse + commercial substrate; S3: Rice husk + organic compost; and S4: Rice husk + commercial substrate). The horizonal dashed line shows the overall mean. Bars shows the mean +- standard error. N = 16.
2.4 FY
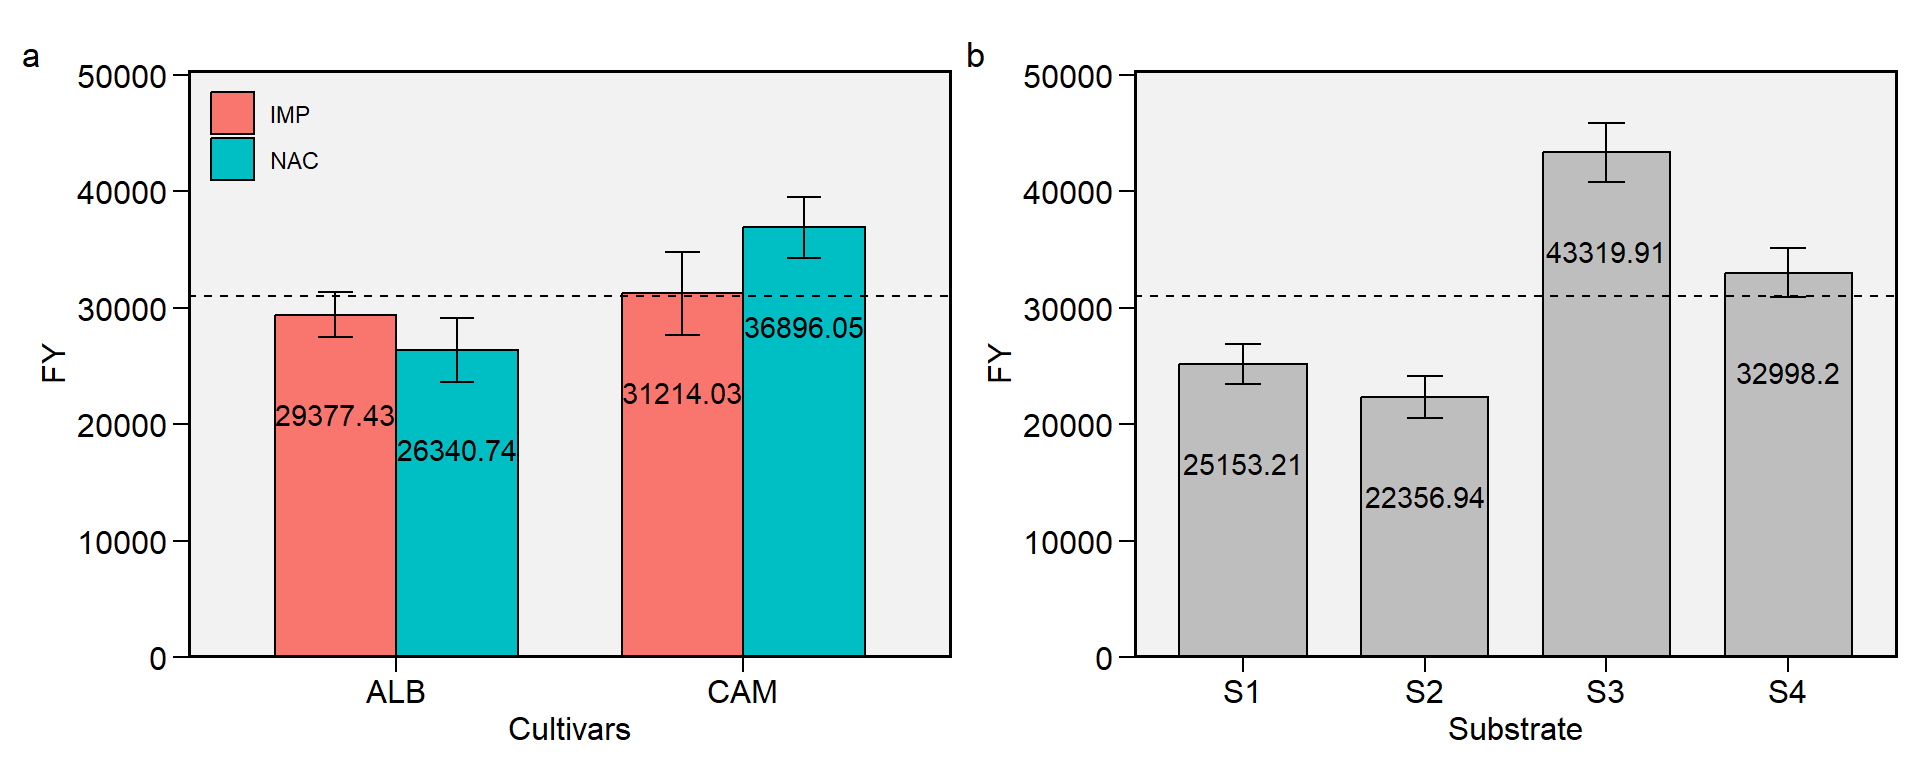
Figure 2.4: Fruit yield. a: Cultivar (ALB: Albion; CAM: Camarosa) x origin (NAC: National; IMP: Imported) interaction; b: substrate main effect (S1: Sugarcane bagasse + organic compost; S2: Sugarcane bagasse + commercial substrate; S3: Rice husk + organic compost; and S4: Rice husk + commercial substrate). The horizonal dashed line shows the overall mean. Bars shows the mean +- standard error. N = 16.
2.5 H
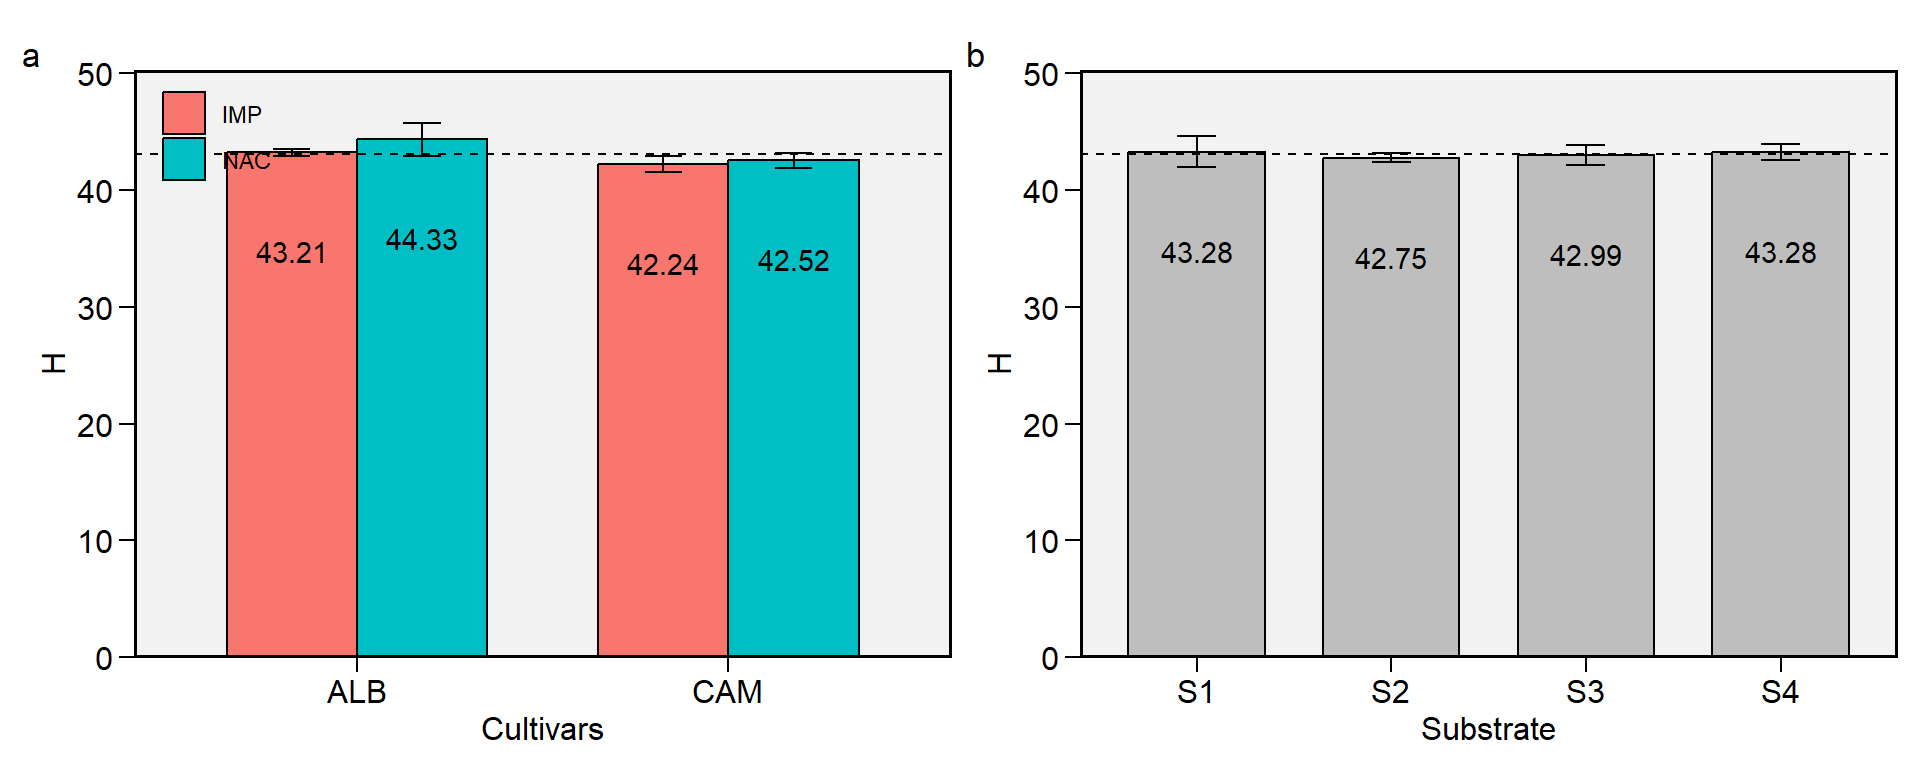
Figure 2.5: Hue angle. a: Cultivar (ALB: Albion; CAM: Camarosa) x origin (NAC: National; IMP: Imported) interaction; b: substrate main effect (S1: Sugarcane bagasse + organic compost; S2: Sugarcane bagasse + commercial substrate; S3: Rice husk + organic compost; and S4: Rice husk + commercial substrate). The horizonal dashed line shows the overall mean. Bars shows the mean +- standard error. N = 16.
2.6 L
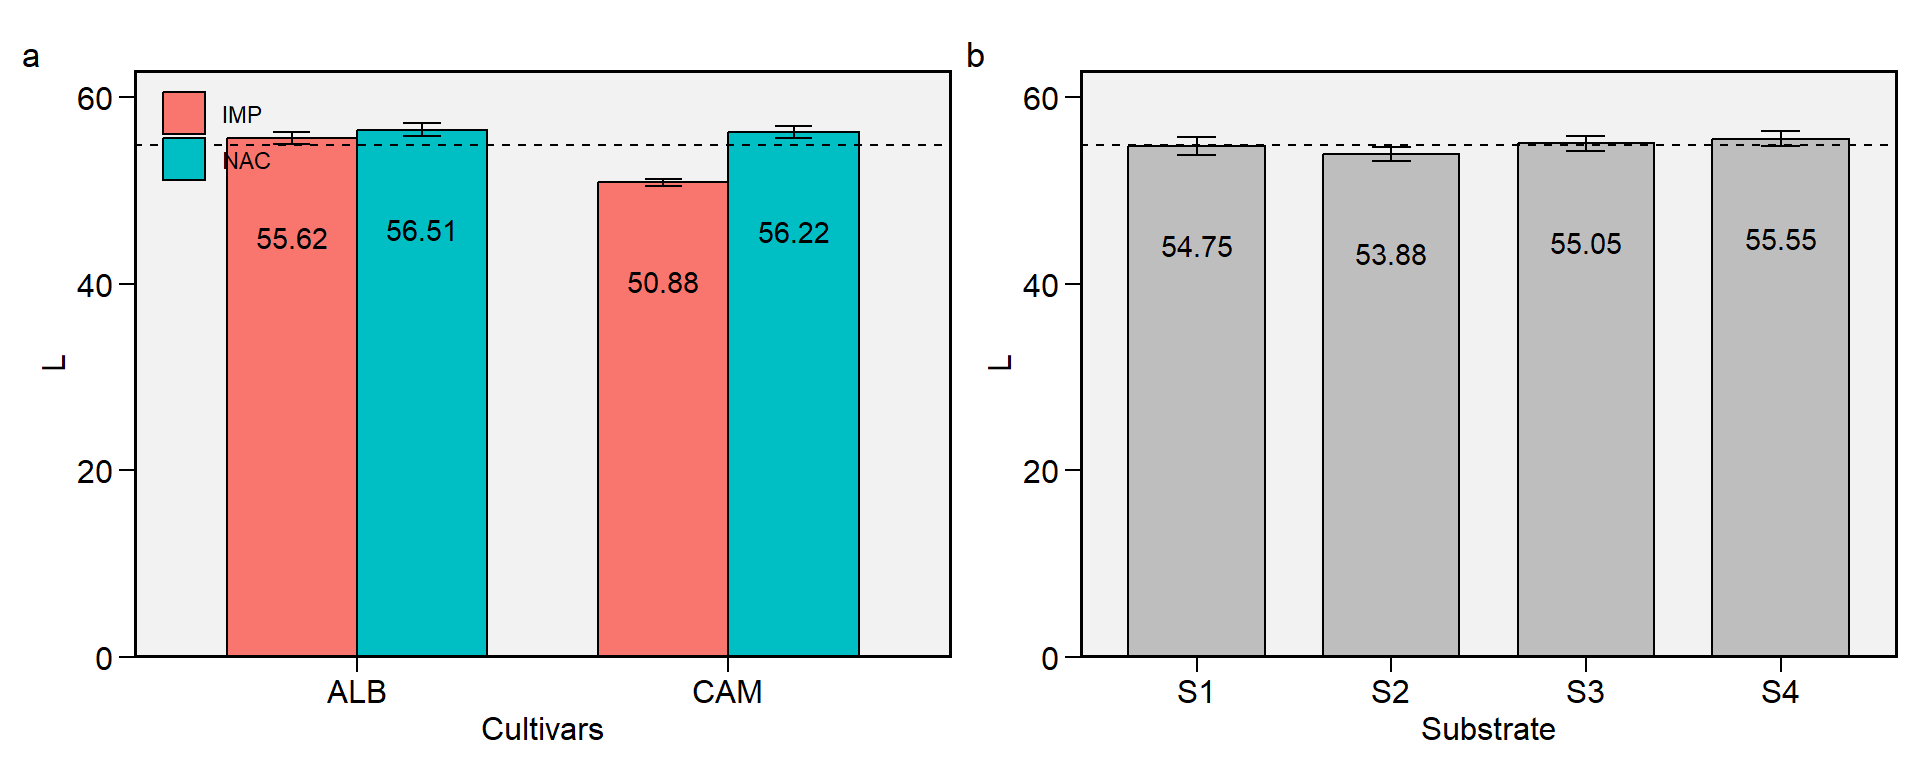
Figure 2.6: L. a: Cultivar (ALB: Albion; CAM: Camarosa) x origin (NAC: National; IMP: Imported) interaction; b: substrate main effect (S1: Sugarcane bagasse + organic compost; S2: Sugarcane bagasse + commercial substrate; S3: Rice husk + organic compost; and S4: Rice husk + commercial substrate). The horizonal dashed line shows the overall mean. Bars shows the mean +- standard error. N = 16.
2.7 NCF
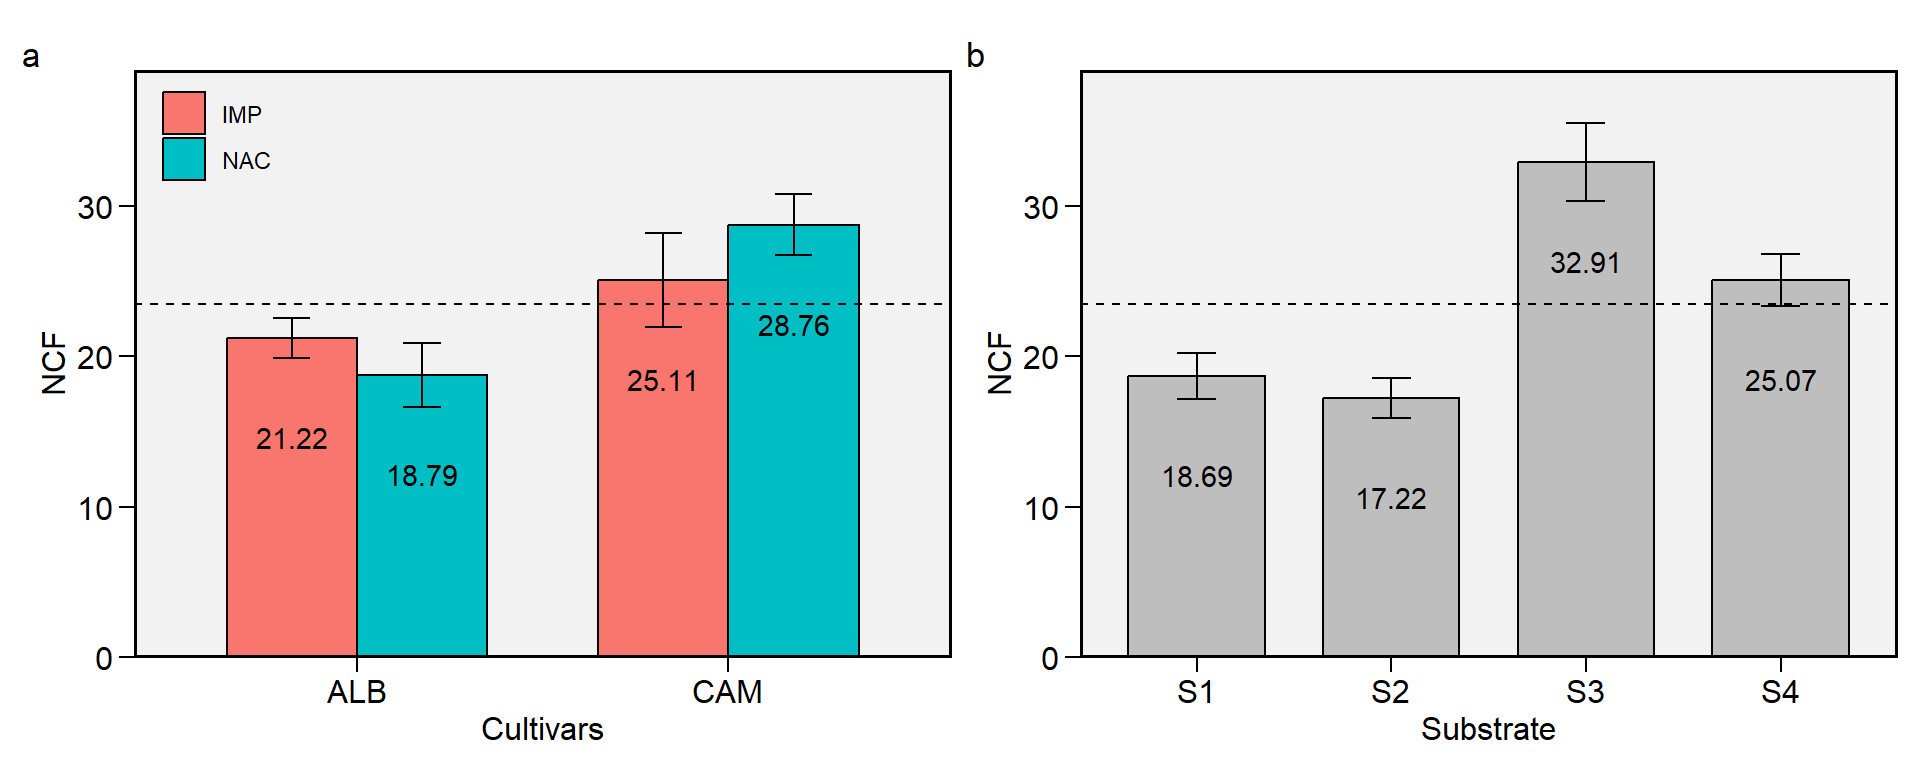
Figure 2.7: Number of commercial fruits. a: Cultivar (ALB: Albion; CAM: Camarosa) x origin (NAC: National; IMP: Imported) interaction; b: substrate main effect (S1: Sugarcane bagasse + organic compost; S2: Sugarcane bagasse + commercial substrate; S3: Rice husk + organic compost; and S4: Rice husk + commercial substrate). The horizonal dashed line shows the overall mean. Bars shows the mean +- standard error. N = 16.
2.8 OAWF
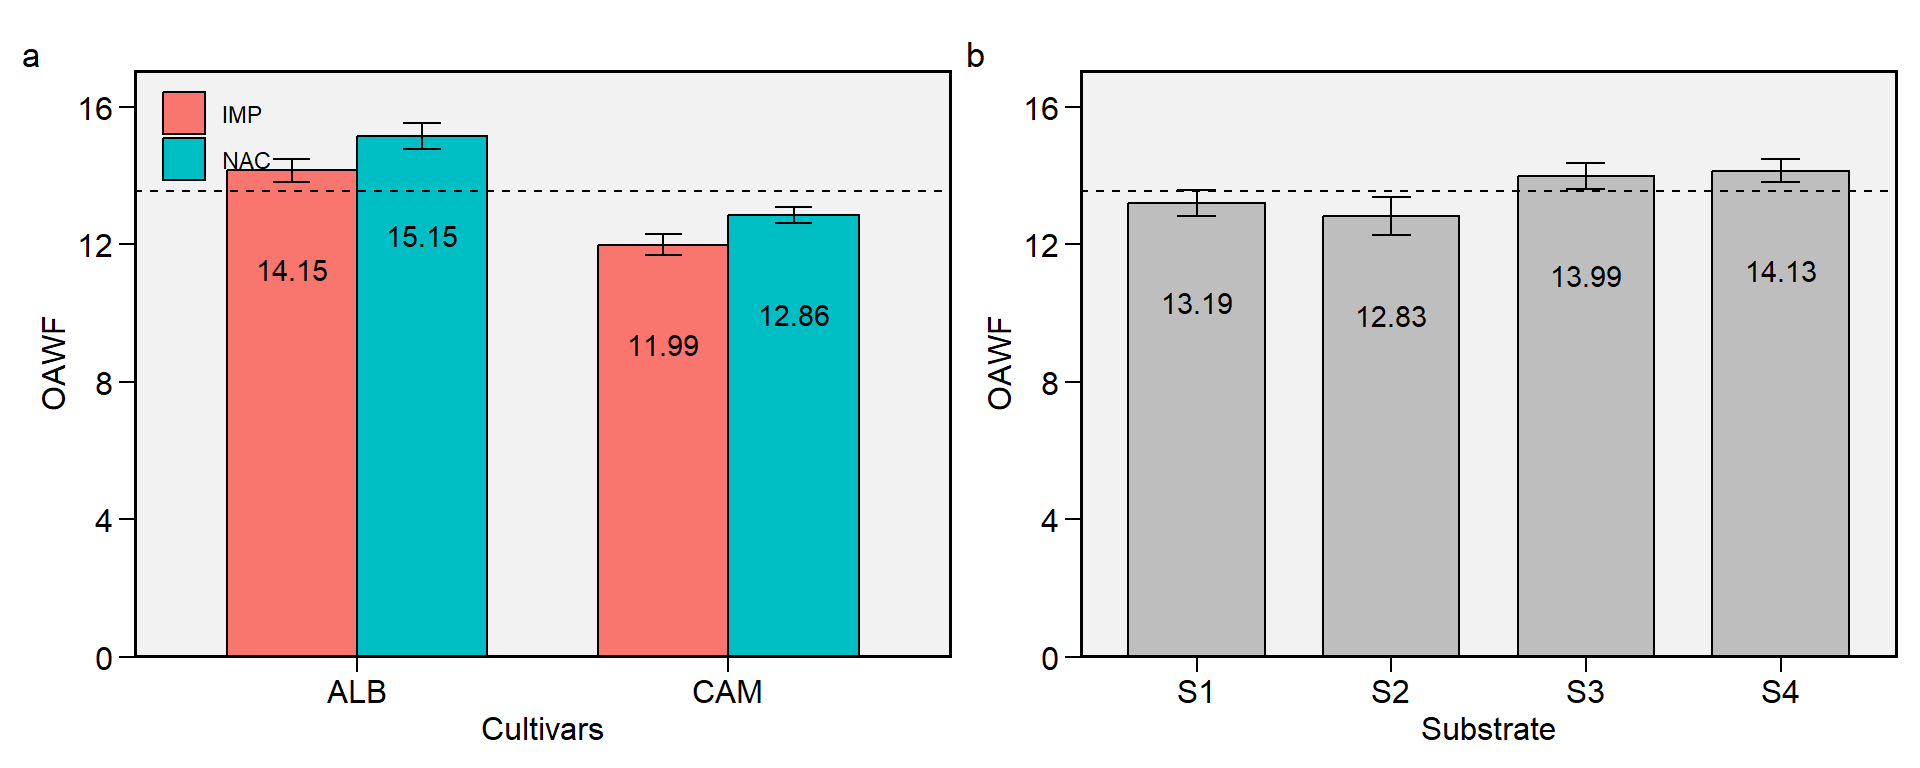
Figure 2.8: Overall average of weigth of fruits. a: Cultivar (ALB: Albion; CAM: Camarosa) x origin (NAC: National; IMP: Imported) interaction; b: substrate main effect (S1: Sugarcane bagasse + organic compost; S2: Sugarcane bagasse + commercial substrate; S3: Rice husk + organic compost; and S4: Rice husk + commercial substrate). The horizonal dashed line shows the overall mean. Bars shows the mean +- standard error. N = 16.
2.9 TNF
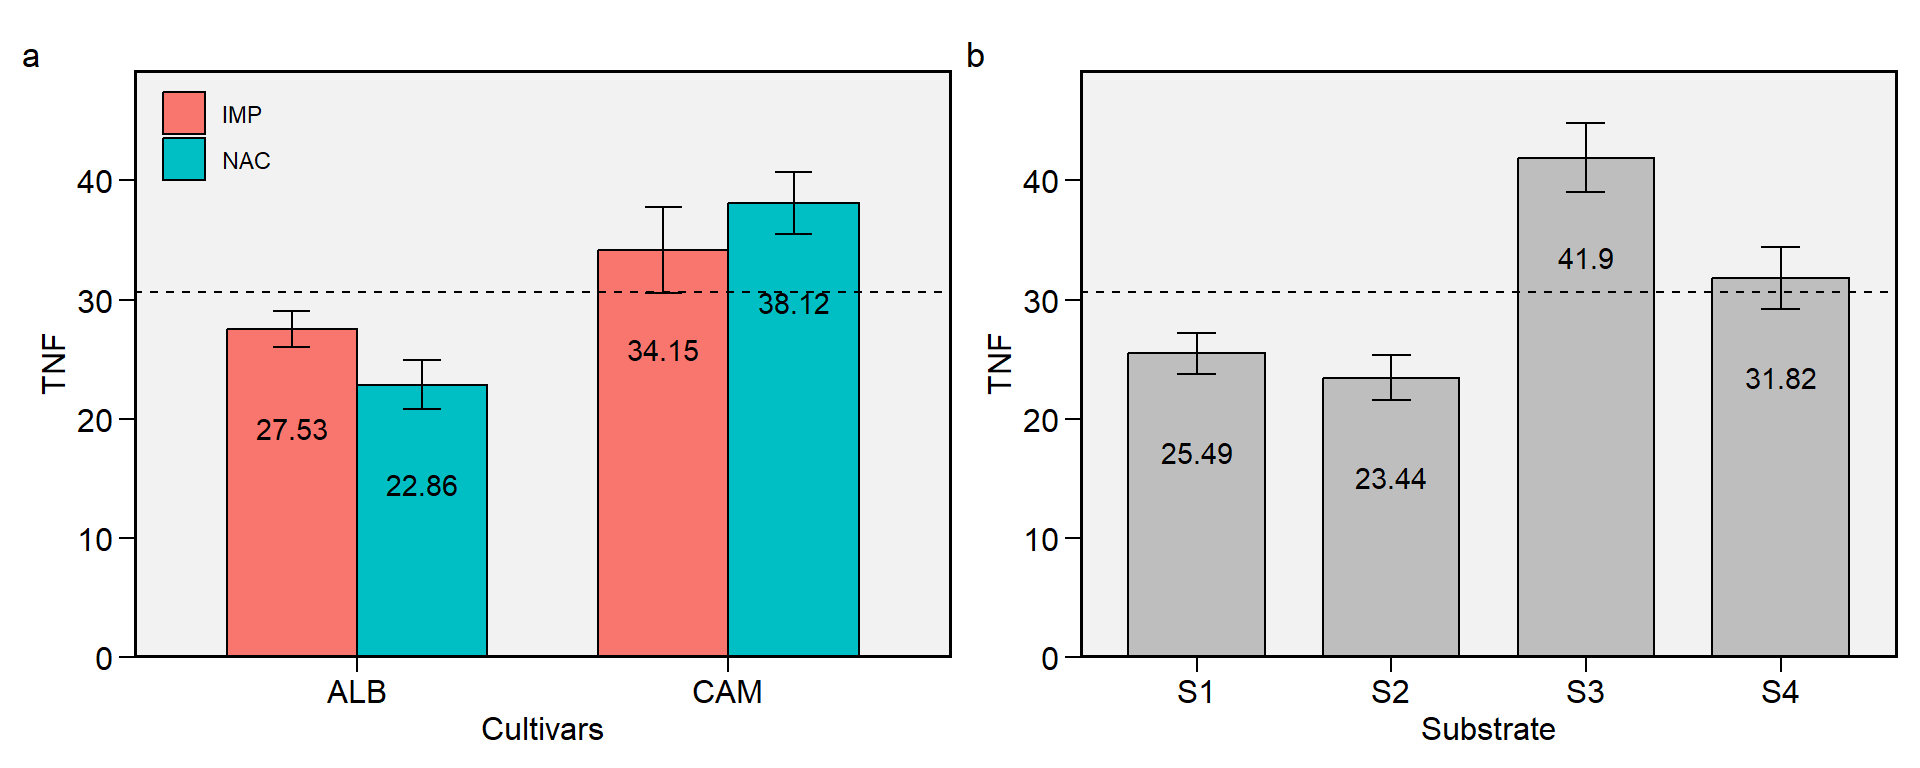
Figure 2.9: Total number of fruits. a: Cultivar (ALB: Albion; CAM: Camarosa) x origin (NAC: National; IMP: Imported) interaction; b: substrate main effect (S1: Sugarcane bagasse + organic compost; S2: Sugarcane bagasse + commercial substrate; S3: Rice husk + organic compost; and S4: Rice husk + commercial substrate). The horizonal dashed line shows the overall mean. Bars shows the mean +- standard error. N = 16.
2.10 TSS
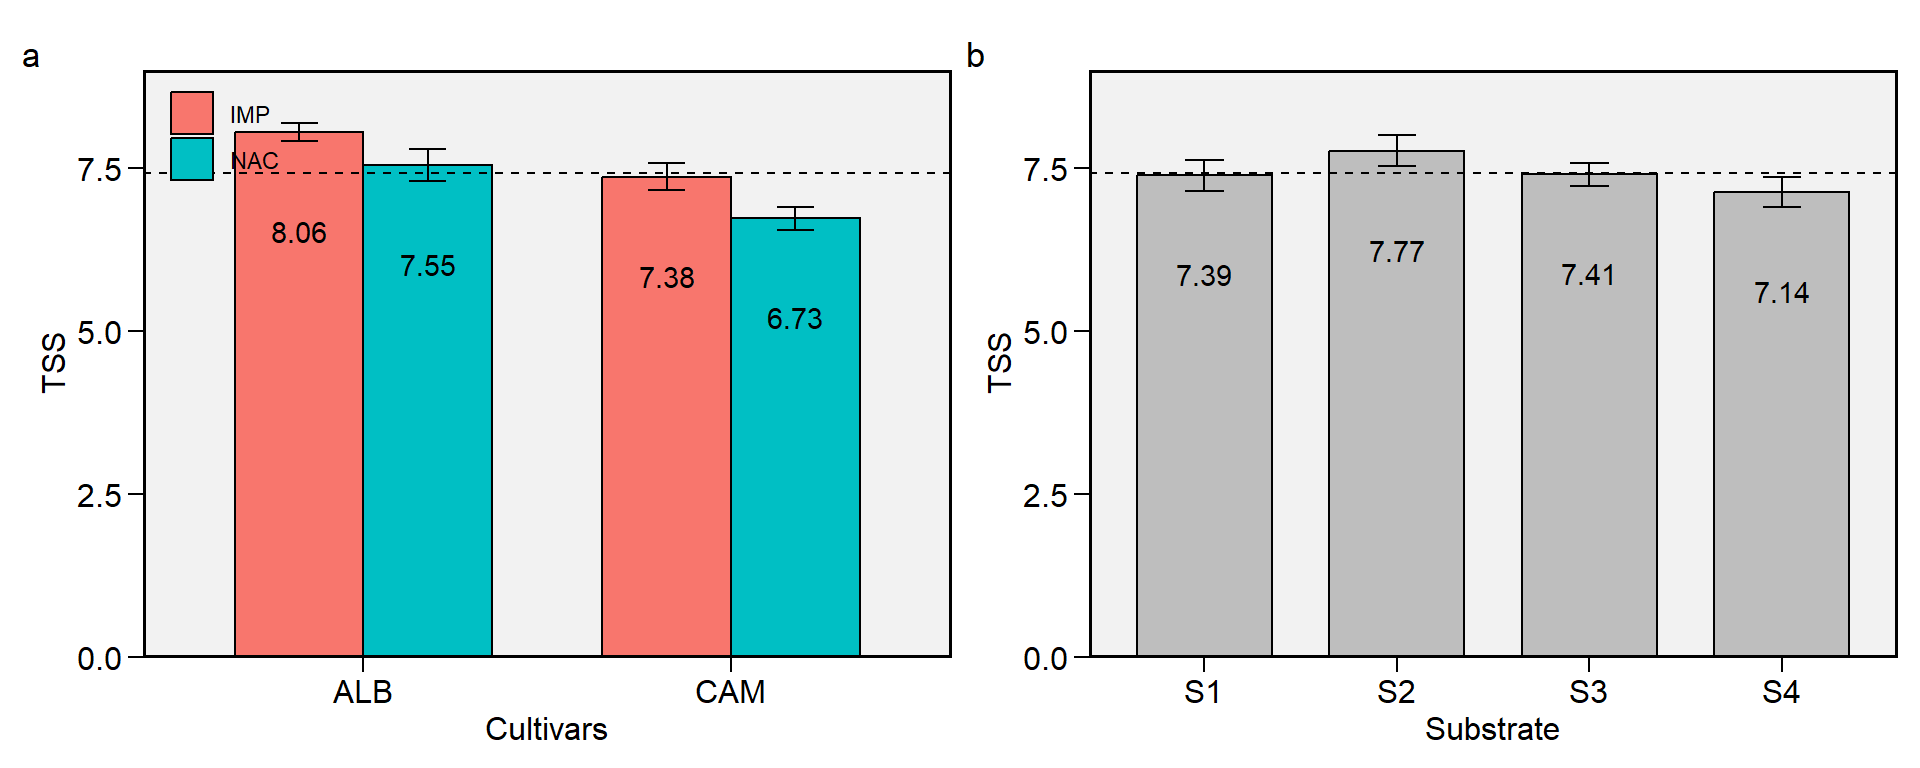
Figure 2.10: Total soluble solids. a: Cultivar (ALB: Albion; CAM: Camarosa) x origin (NAC: National; IMP: Imported) interaction; b: substrate main effect (S1: Sugarcane bagasse + organic compost; S2: Sugarcane bagasse + commercial substrate; S3: Rice husk + organic compost; and S4: Rice husk + commercial substrate). The horizonal dashed line shows the overall mean. Bars shows the mean +- standard error. N = 16.
2.11 TSS_TA
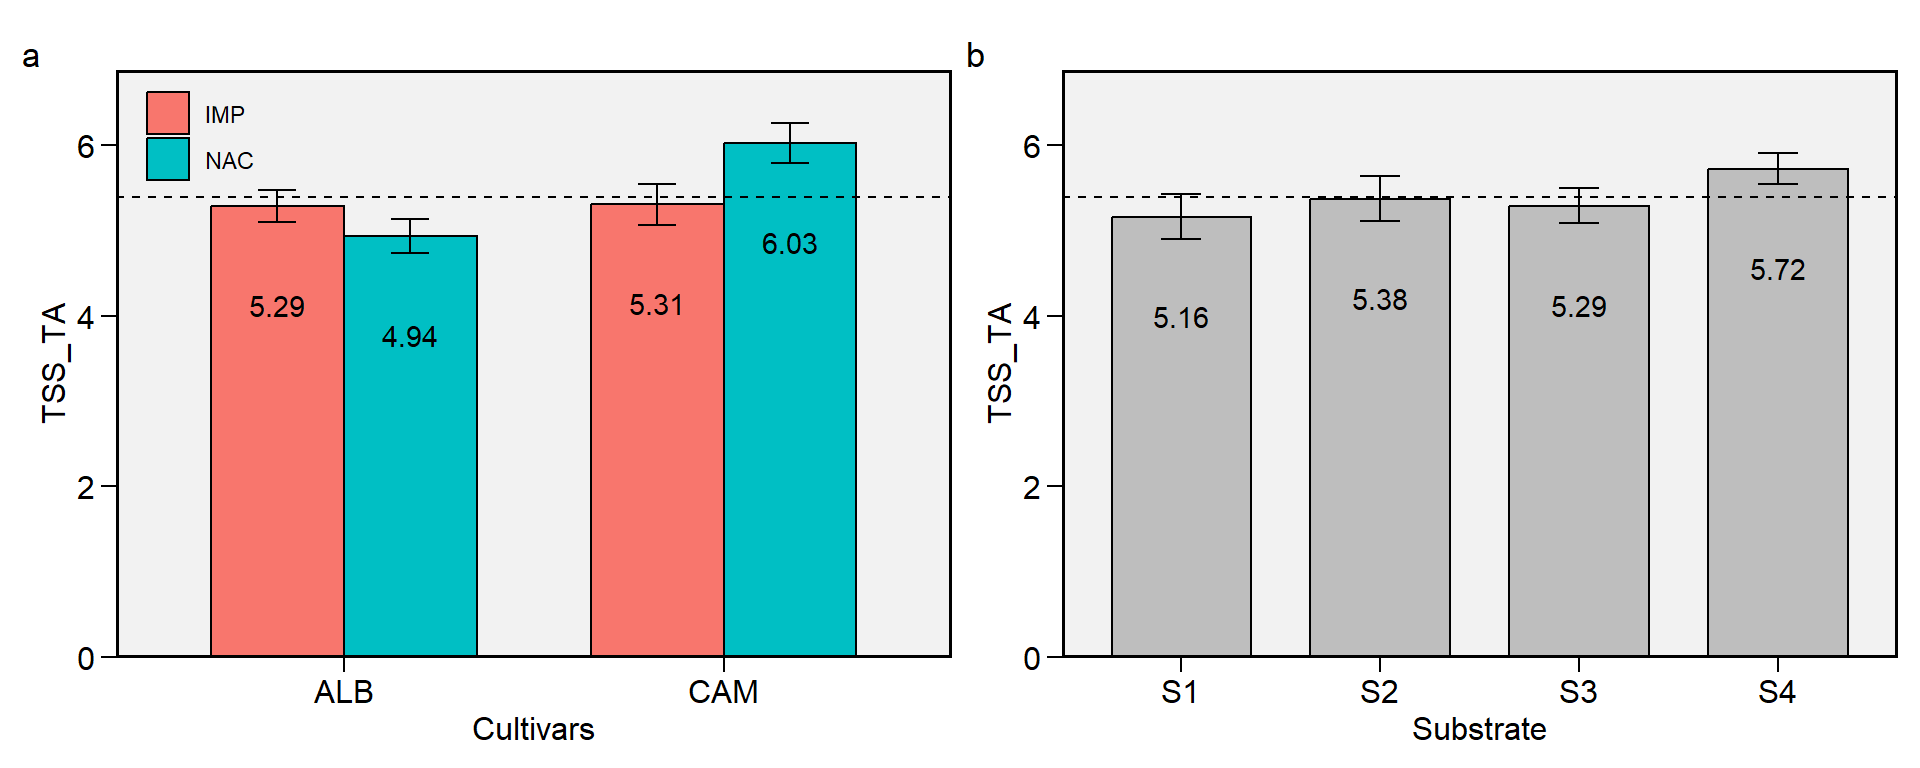
Figure 2.11: TSS/TA ratio. a: Cultivar (ALB: Albion; CAM: Camarosa) x origin (NAC: National; IMP: Imported) interaction; b: substrate main effect (S1: Sugarcane bagasse + organic compost; S2: Sugarcane bagasse + commercial substrate; S3: Rice husk + organic compost; and S4: Rice husk + commercial substrate). The horizonal dashed line shows the overall mean. Bars shows the mean +- standard error. N = 16.
2.12 TWF
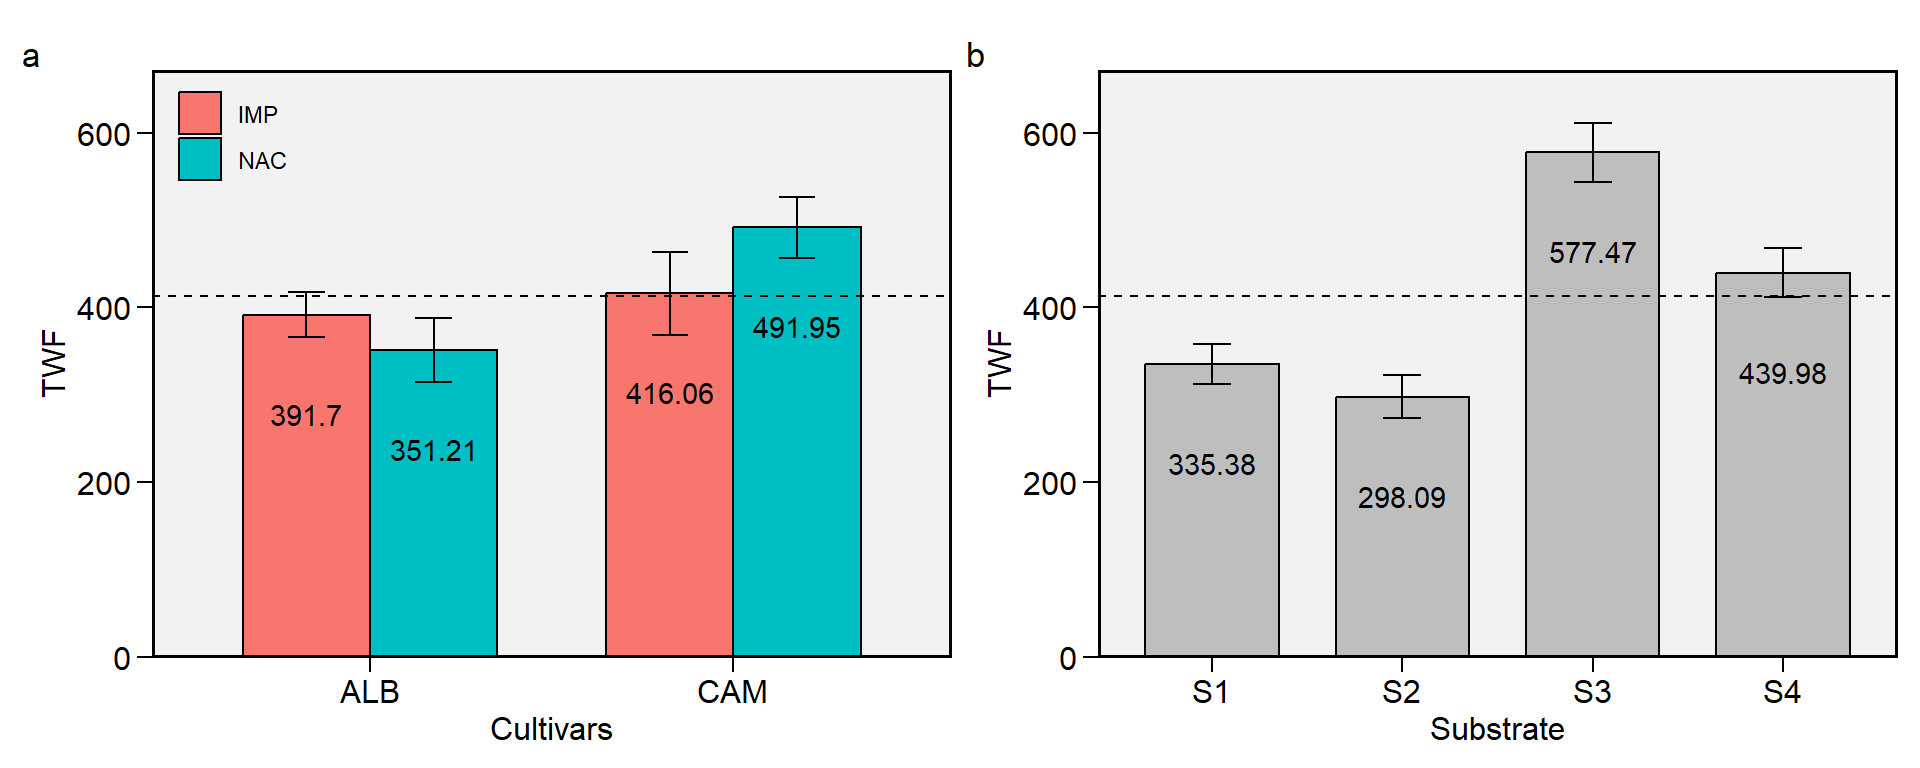
Figure 2.12: Total weight of fruits. a: Cultivar (ALB: Albion; CAM: Camarosa) x origin (NAC: National; IMP: Imported) interaction; b: substrate main effect (S1: Sugarcane bagasse + organic compost; S2: Sugarcane bagasse + commercial substrate; S3: Rice husk + organic compost; and S4: Rice husk + commercial substrate). The horizonal dashed line shows the overall mean. Bars shows the mean +- standard error. N = 16.
2.13 WCF
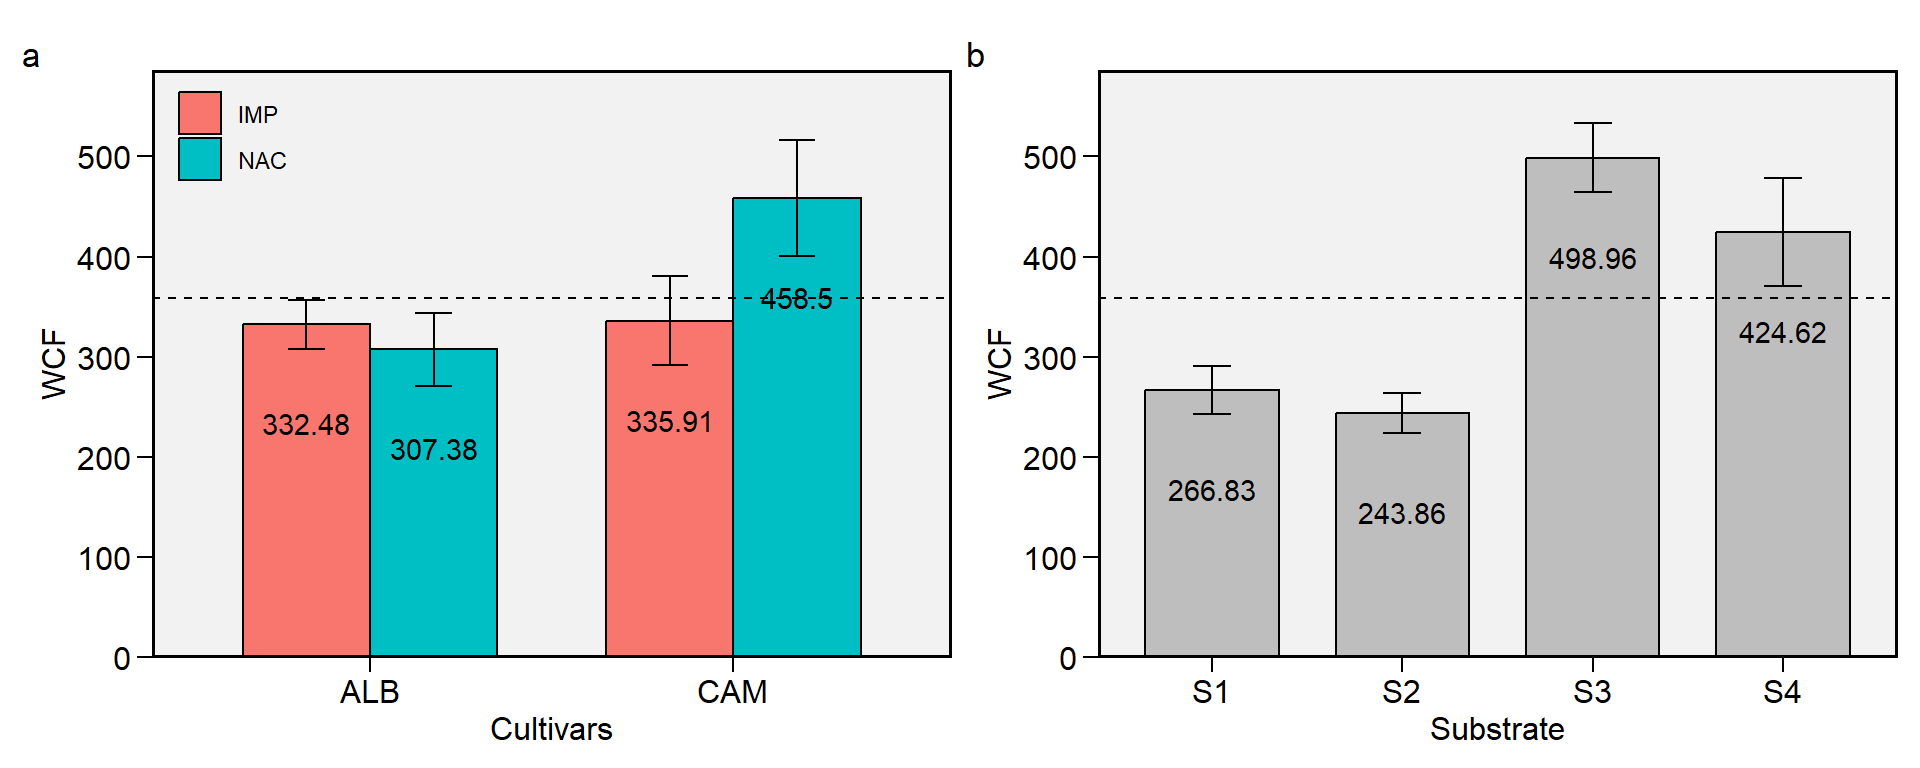
Figure 2.13: Weight of commercial fruits. a: Cultivar (ALB: Albion; CAM: Camarosa) x origin (NAC: National; IMP: Imported) interaction; b: substrate main effect (S1: Sugarcane bagasse + organic compost; S2: Sugarcane bagasse + commercial substrate; S3: Rice husk + organic compost; and S4: Rice husk + commercial substrate). The horizonal dashed line shows the overall mean. Bars shows the mean +- standard error. N = 16.
3 Water retention curve
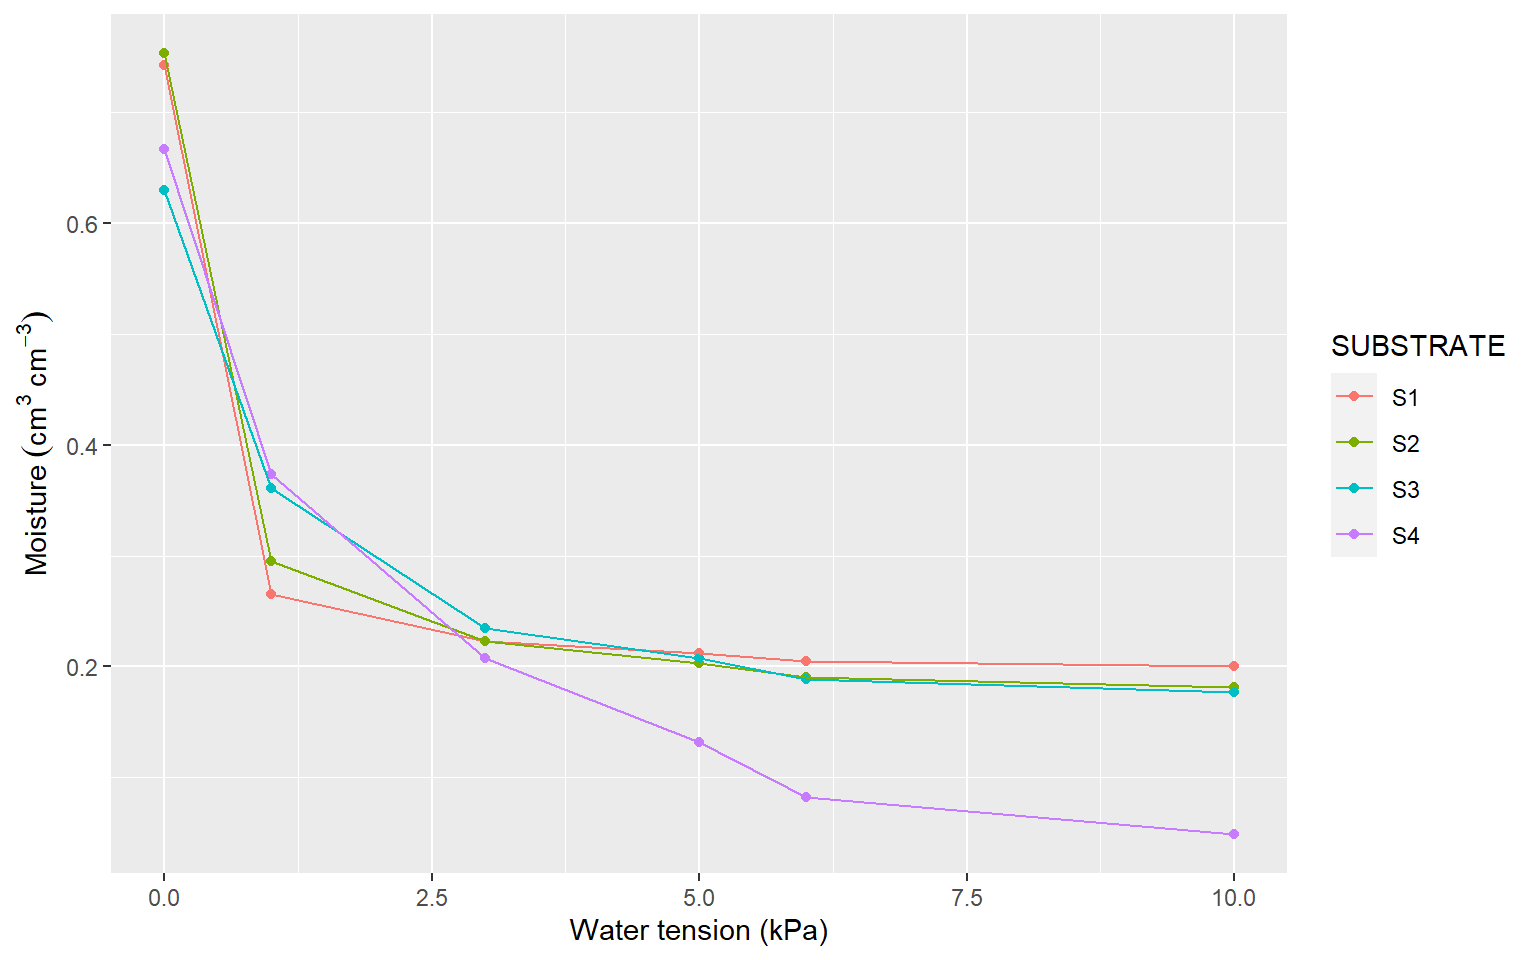
Figure 3.1: Water retention curve for different substrates used in the experiment.
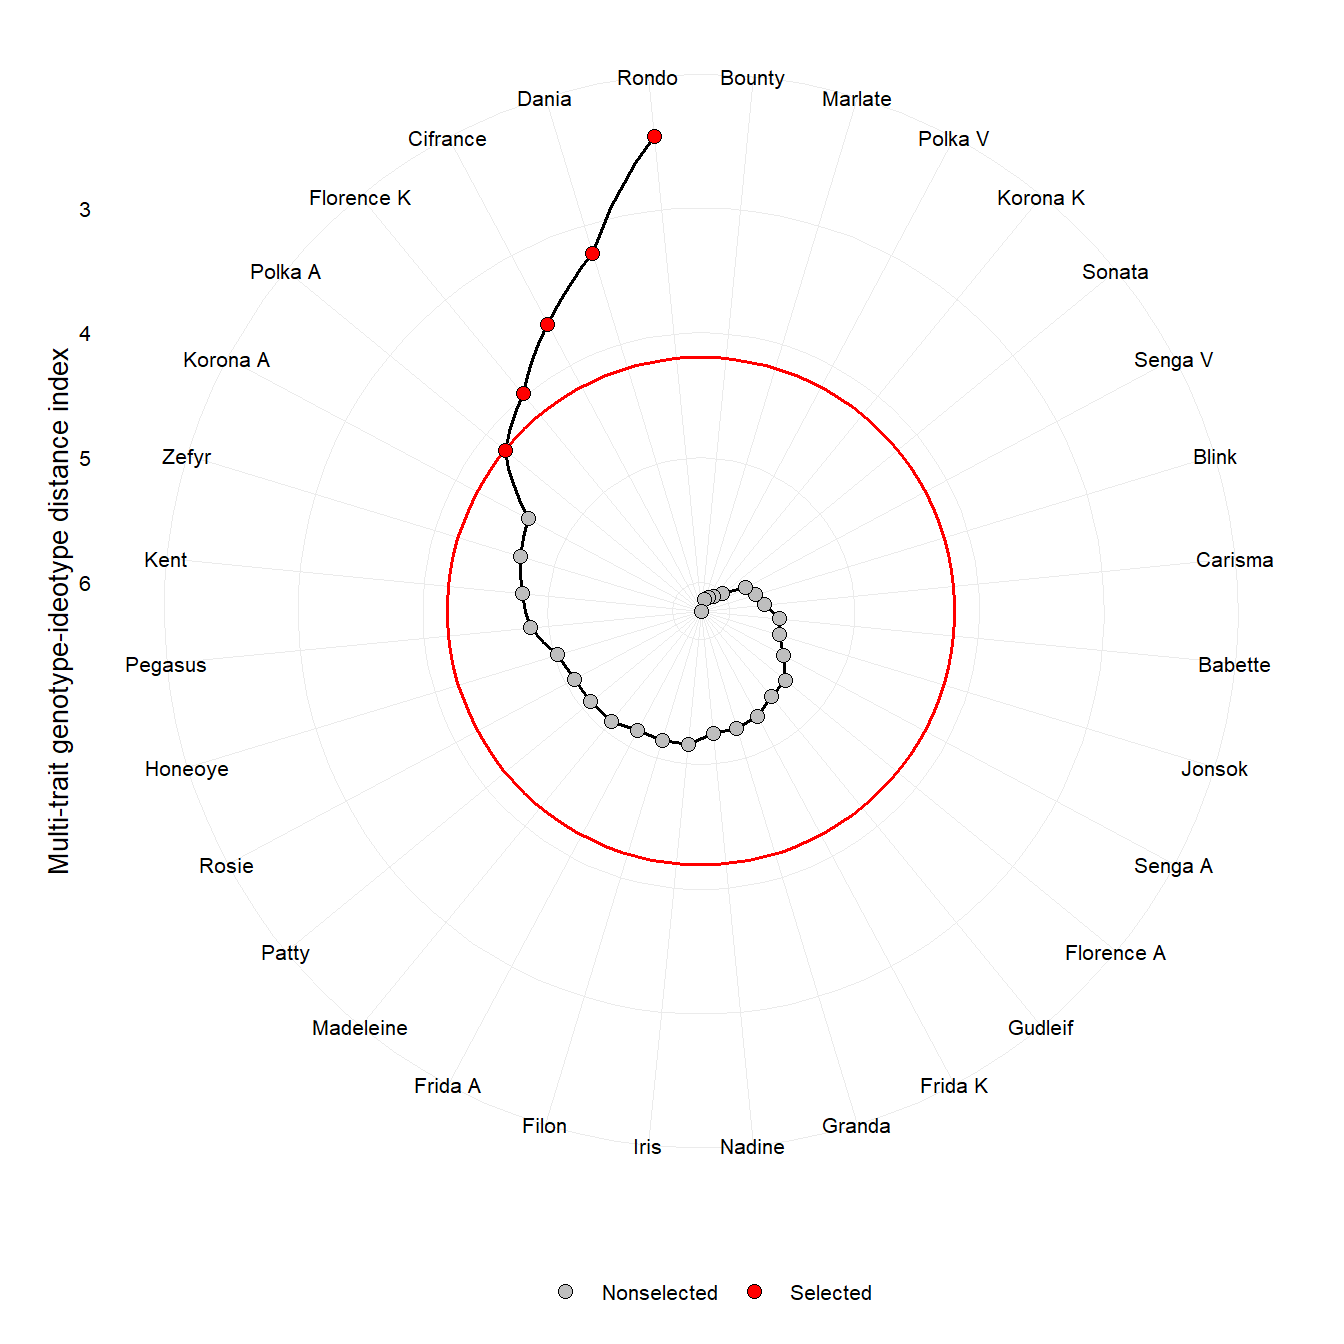
4 Example (Aaby 2012)
In this example, we compute the MGIDI index for ranking 32 cultivars based on 18 traits. The original article is found at http://link.springer.com/10.1007/BF02289233
mgidi_aaby <-
import("data/df_aaby.xlsx") |>
tidy_colnames() |>
column_to_rownames("CULTIVAR") |>
mgidi(SI = 2)
##
## -------------------------------------------------------------------------------
## Principal Component Analysis
## -------------------------------------------------------------------------------
## # A tibble: 18 × 4
## PC Eigenvalues `Variance (%)` `Cum. variance (%)`
## <chr> <dbl> <dbl> <dbl>
## 1 PC1 6.12 34.0 34.0
## 2 PC2 3.4 18.9 52.9
## 3 PC3 1.92 10.7 63.6
## 4 PC4 1.46 8.11 71.7
## 5 PC5 1.06 5.86 77.5
## 6 PC6 0.87 4.85 82.4
## 7 PC7 0.7 3.9 86.3
## 8 PC8 0.6 3.36 89.6
## 9 PC9 0.44 2.46 92.1
## 10 PC10 0.36 1.99 94.1
## 11 PC11 0.29 1.64 95.7
## 12 PC12 0.26 1.44 97.2
## 13 PC13 0.19 1.08 98.2
## 14 PC14 0.12 0.68 98.9
## 15 PC15 0.1 0.58 99.5
## 16 PC16 0.06 0.35 99.8
## 17 PC17 0.03 0.17 100
## 18 PC18 0 0 100
## -------------------------------------------------------------------------------
## Factor Analysis - factorial loadings after rotation-
## -------------------------------------------------------------------------------
## # A tibble: 18 × 8
## VAR FA1 FA2 FA3 FA4 FA5 Communality Unique…¹
## <chr> <dbl> <dbl> <dbl> <dbl> <dbl> <dbl> <dbl>
## 1 CYD_3_GLU -0.04 0.02 0.21 0.05 -0.92 0.89 0.11
## 2 PG_3_GLU -0.17 -0.21 0.61 0.3 -0.59 0.88 0.12
## 3 PG_3_RUT -0.8 -0.19 0.13 0.19 -0.22 0.77 0.23
## 4 CYD_3_MALGLU -0.57 0.05 0.08 -0.11 -0.76 0.93 0.07
## 5 PG_3_MALGLU -0.81 -0.09 0.31 -0.14 -0.3 0.86 0.14
## 6 PG_3_ACETGLU 0.68 0.18 0.48 -0.07 -0.26 0.8 0.2
## 7 TOTAL_ANTHOCY_ -0.47 -0.19 0.55 0.17 -0.6 0.95 0.05
## 8 QUERCETIN_GLYCOSIDESC_D 0.05 -0.28 0.21 0.69 -0.47 0.82 0.18
## 9 KAEMPFEROL_GLYCOSIDESD_E -0.54 -0.23 0.14 0.49 -0.12 0.62 0.38
## 10 _CATECHINF_G -0.08 -0.69 -0.55 0.09 -0.08 0.8 0.2
## 11 PROCYANIDIN_DIMERSG_H -0.44 -0.59 0.05 0.48 -0.01 0.77 0.23
## 12 PROCYANIDIN_TRIMERG -0.25 -0.79 -0.08 0.18 -0.18 0.76 0.24
## 13 AGRIMONIINC -0.06 -0.79 0.06 -0.21 -0.04 0.67 0.33
## 14 OTHER_ETC_CD -0.17 -0.79 0.1 0.16 0.13 0.7 0.3
## 15 ELLAGIC_ACIDE -0.08 -0.53 -0.29 0.38 -0.39 0.67 0.33
## 16 ELLAGIC_ACID_GLYCOSIDESE_F 0.21 -0.55 0.12 0.53 0.04 0.64 0.36
## 17 COUMAROYL_HEXOSESG -0.15 0.09 -0.14 0.86 0.06 0.79 0.21
## 18 CINNAMOYL_GLUCOSEH 0.17 -0.04 -0.76 0.04 0.2 0.64 0.36
## # … with abbreviated variable name ¹Uniquenesses
## -------------------------------------------------------------------------------
## Comunalit Mean: 0.7752721
## -------------------------------------------------------------------------------
## Selection differential
## -------------------------------------------------------------------------------
## # A tibble: 18 × 8
## VAR Factor Xo Xs SD SDperc sense goal
## <chr> <chr> <dbl> <dbl> <dbl> <dbl> <chr> <dbl>
## 1 PG_3_RUT FA1 1.13 2.2 1.07 94.5 increa… 100
## 2 PG_3_MALGLU FA1 5.99 12.3 6.31 105. increa… 100
## 3 PG_3_ACETGLU FA1 0.0812 0 -0.0812 -100 increa… 0
## 4 KAEMPFEROL_GLYCOSIDESD_E FA1 0.844 1.5 0.656 77.8 increa… 100
## 5 _CATECHINF_G FA2 4.47 6.1 1.63 36.4 increa… 100
## 6 PROCYANIDIN_DIMERSG_H FA2 9.06 13.3 4.24 46.8 increa… 100
## 7 PROCYANIDIN_TRIMERG FA2 7.90 12.4 4.50 57.0 increa… 100
## 8 AGRIMONIINC FA2 8.83 12.6 3.77 42.7 increa… 100
## 9 OTHER_ETC_CD FA2 2.78 2.7 -0.0781 -2.81 increa… 0
## 10 ELLAGIC_ACIDE FA2 0.519 0.7 0.181 34.9 increa… 100
## 11 ELLAGIC_ACID_GLYCOSIDESE_F FA2 0.581 0.8 0.219 37.6 increa… 100
## 12 PG_3_GLU FA3 25.3 47.7 22.4 88.8 increa… 100
## 13 CINNAMOYL_GLUCOSEH FA3 4.98 3.5 -1.48 -29.8 increa… 0
## 14 QUERCETIN_GLYCOSIDESC_D FA4 1.8 5.2 3.4 189. increa… 100
## 15 COUMAROYL_HEXOSESG FA4 5.44 7 1.56 28.6 increa… 100
## 16 CYD_3_GLU FA5 1.09 2.9 1.81 167. increa… 100
## 17 CYD_3_MALGLU FA5 0.356 0.9 0.544 153. increa… 100
## 18 TOTAL_ANTHOCY_ FA5 33.9 65.9 32.0 94.3 increa… 100
## ------------------------------------------------------------------------------
## Selected genotypes
## -------------------------------------------------------------------------------
## Rondo
## -------------------------------------------------------------------------------
plot(mgidi_aaby)