Supplementary figures
Figure S1
## ------------------------------------------------
## ATTENTION: This function requires internet access
## ------------------------------------------------
## Connecting to the NASA POWER API Client, Sparks et al 2018
## https://docs.ropensci.org/nasapower
## ------------------------------------------------
## ----------------------------------------------------------------------
## Extraterrestrial radiation (RTA, MJ/m^2/day)
## Daylight hours (N, hours)
## Actual duration of sunshine (n, hours)
## ----------------------------------------------------------------------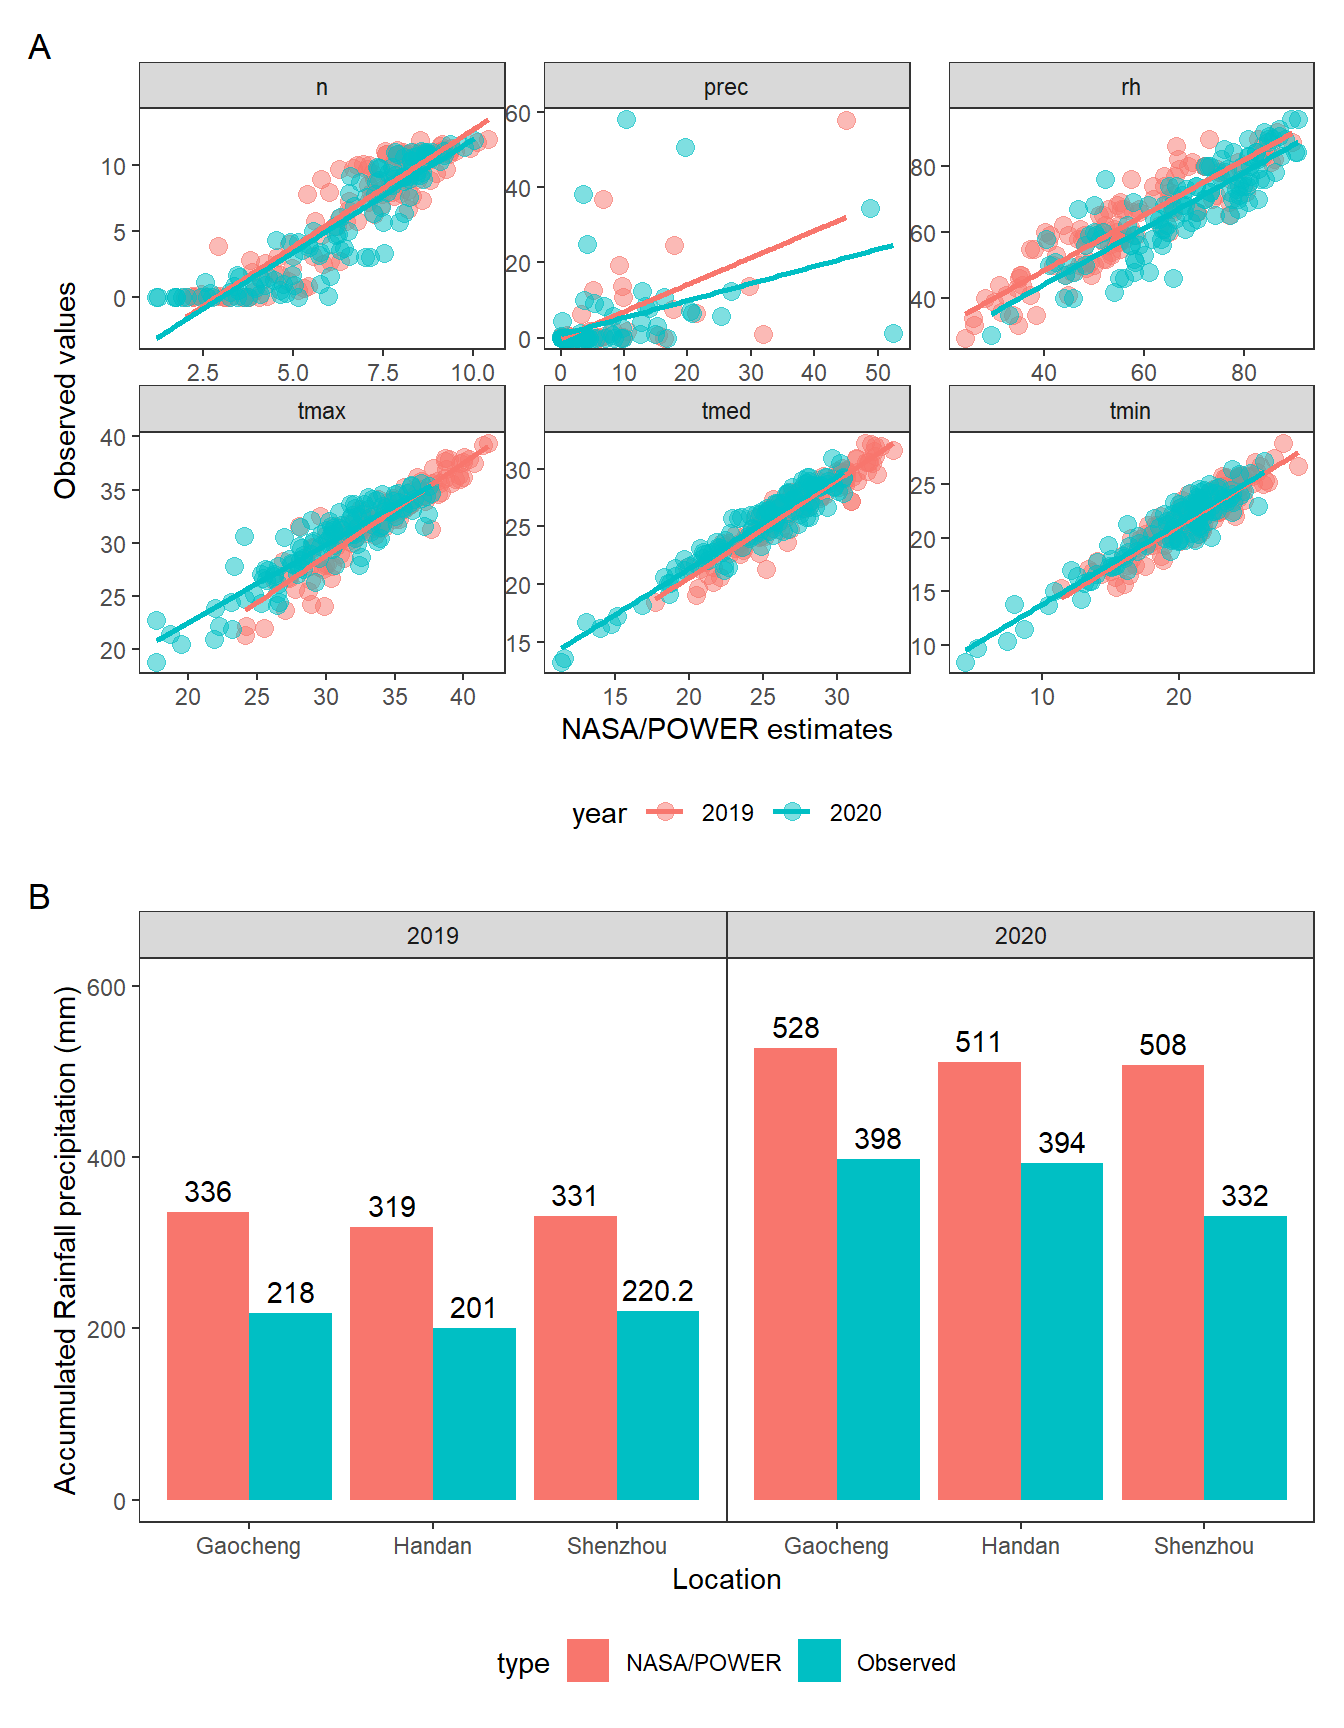
Figure 1: NASA/POWER estimates vs observed values. (A) Relationship between NASA/POWER estimates and observed values (observed in Shenzhou) for daylight hours (n), rainfall precipitation (prec), relative humidity (rh), maximum air temperature (tmax), average air temperature (tmed), and minimum air temperature (tmin); (B) NASA/POWER vs observed values for accumulated rainfall in three different locations.
Figure S2
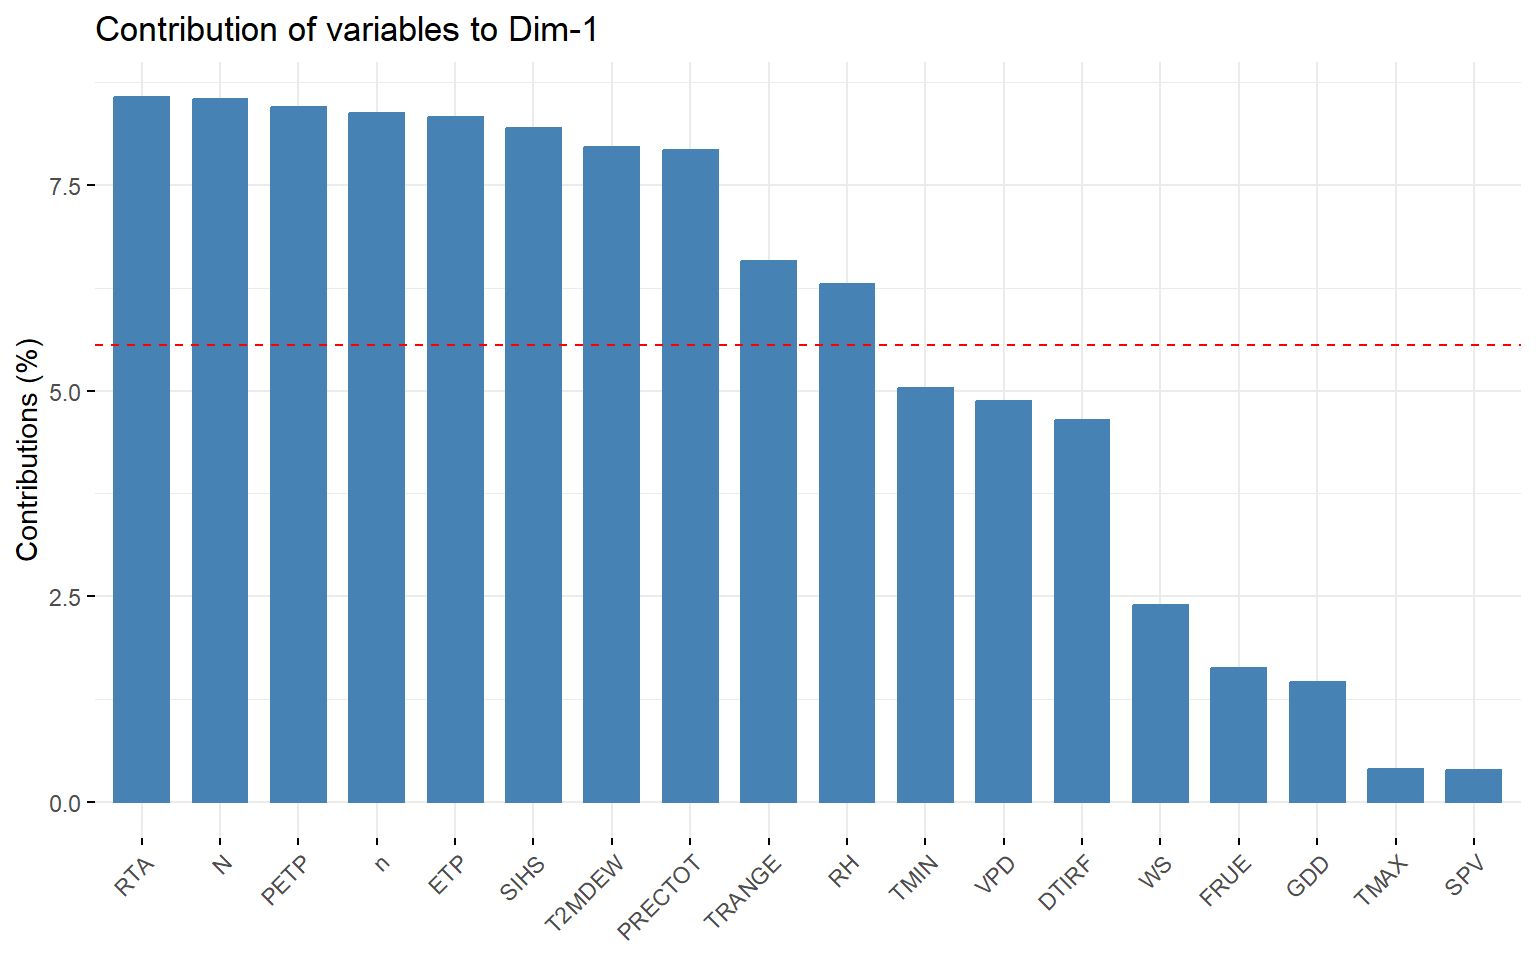
Figure 2: biplot
Figure S3
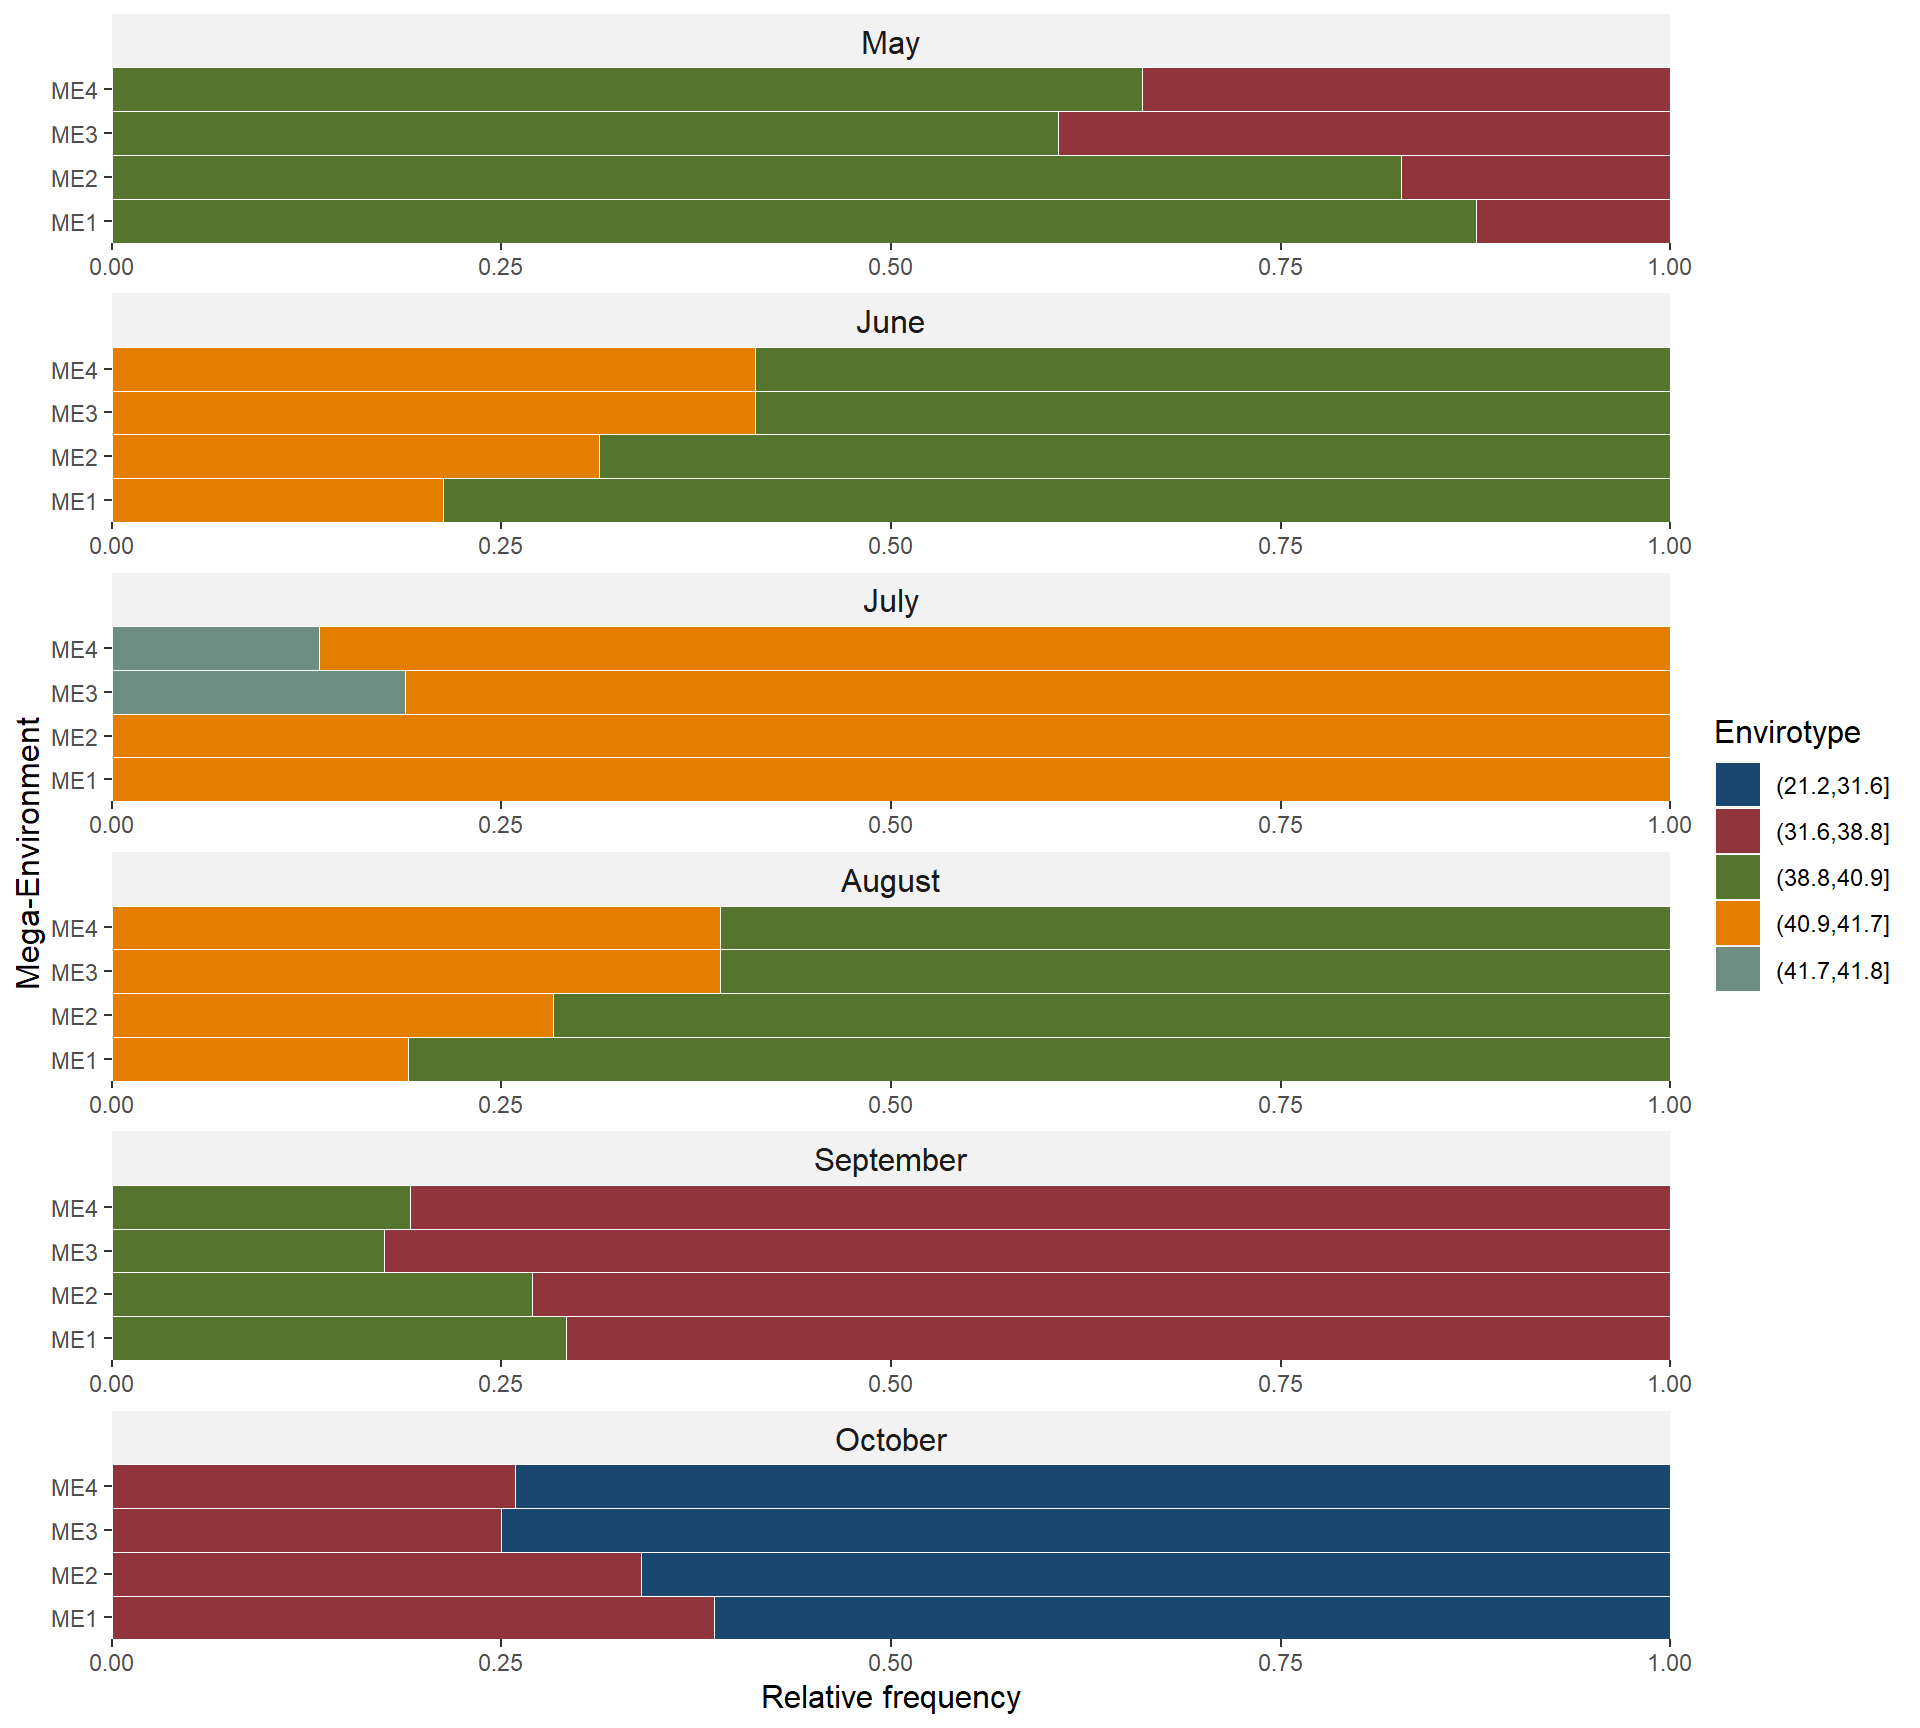
Figure 3: Quantiles for Extraterrestrial radiation over six months observed in the delineated mega-environments
Figure S4
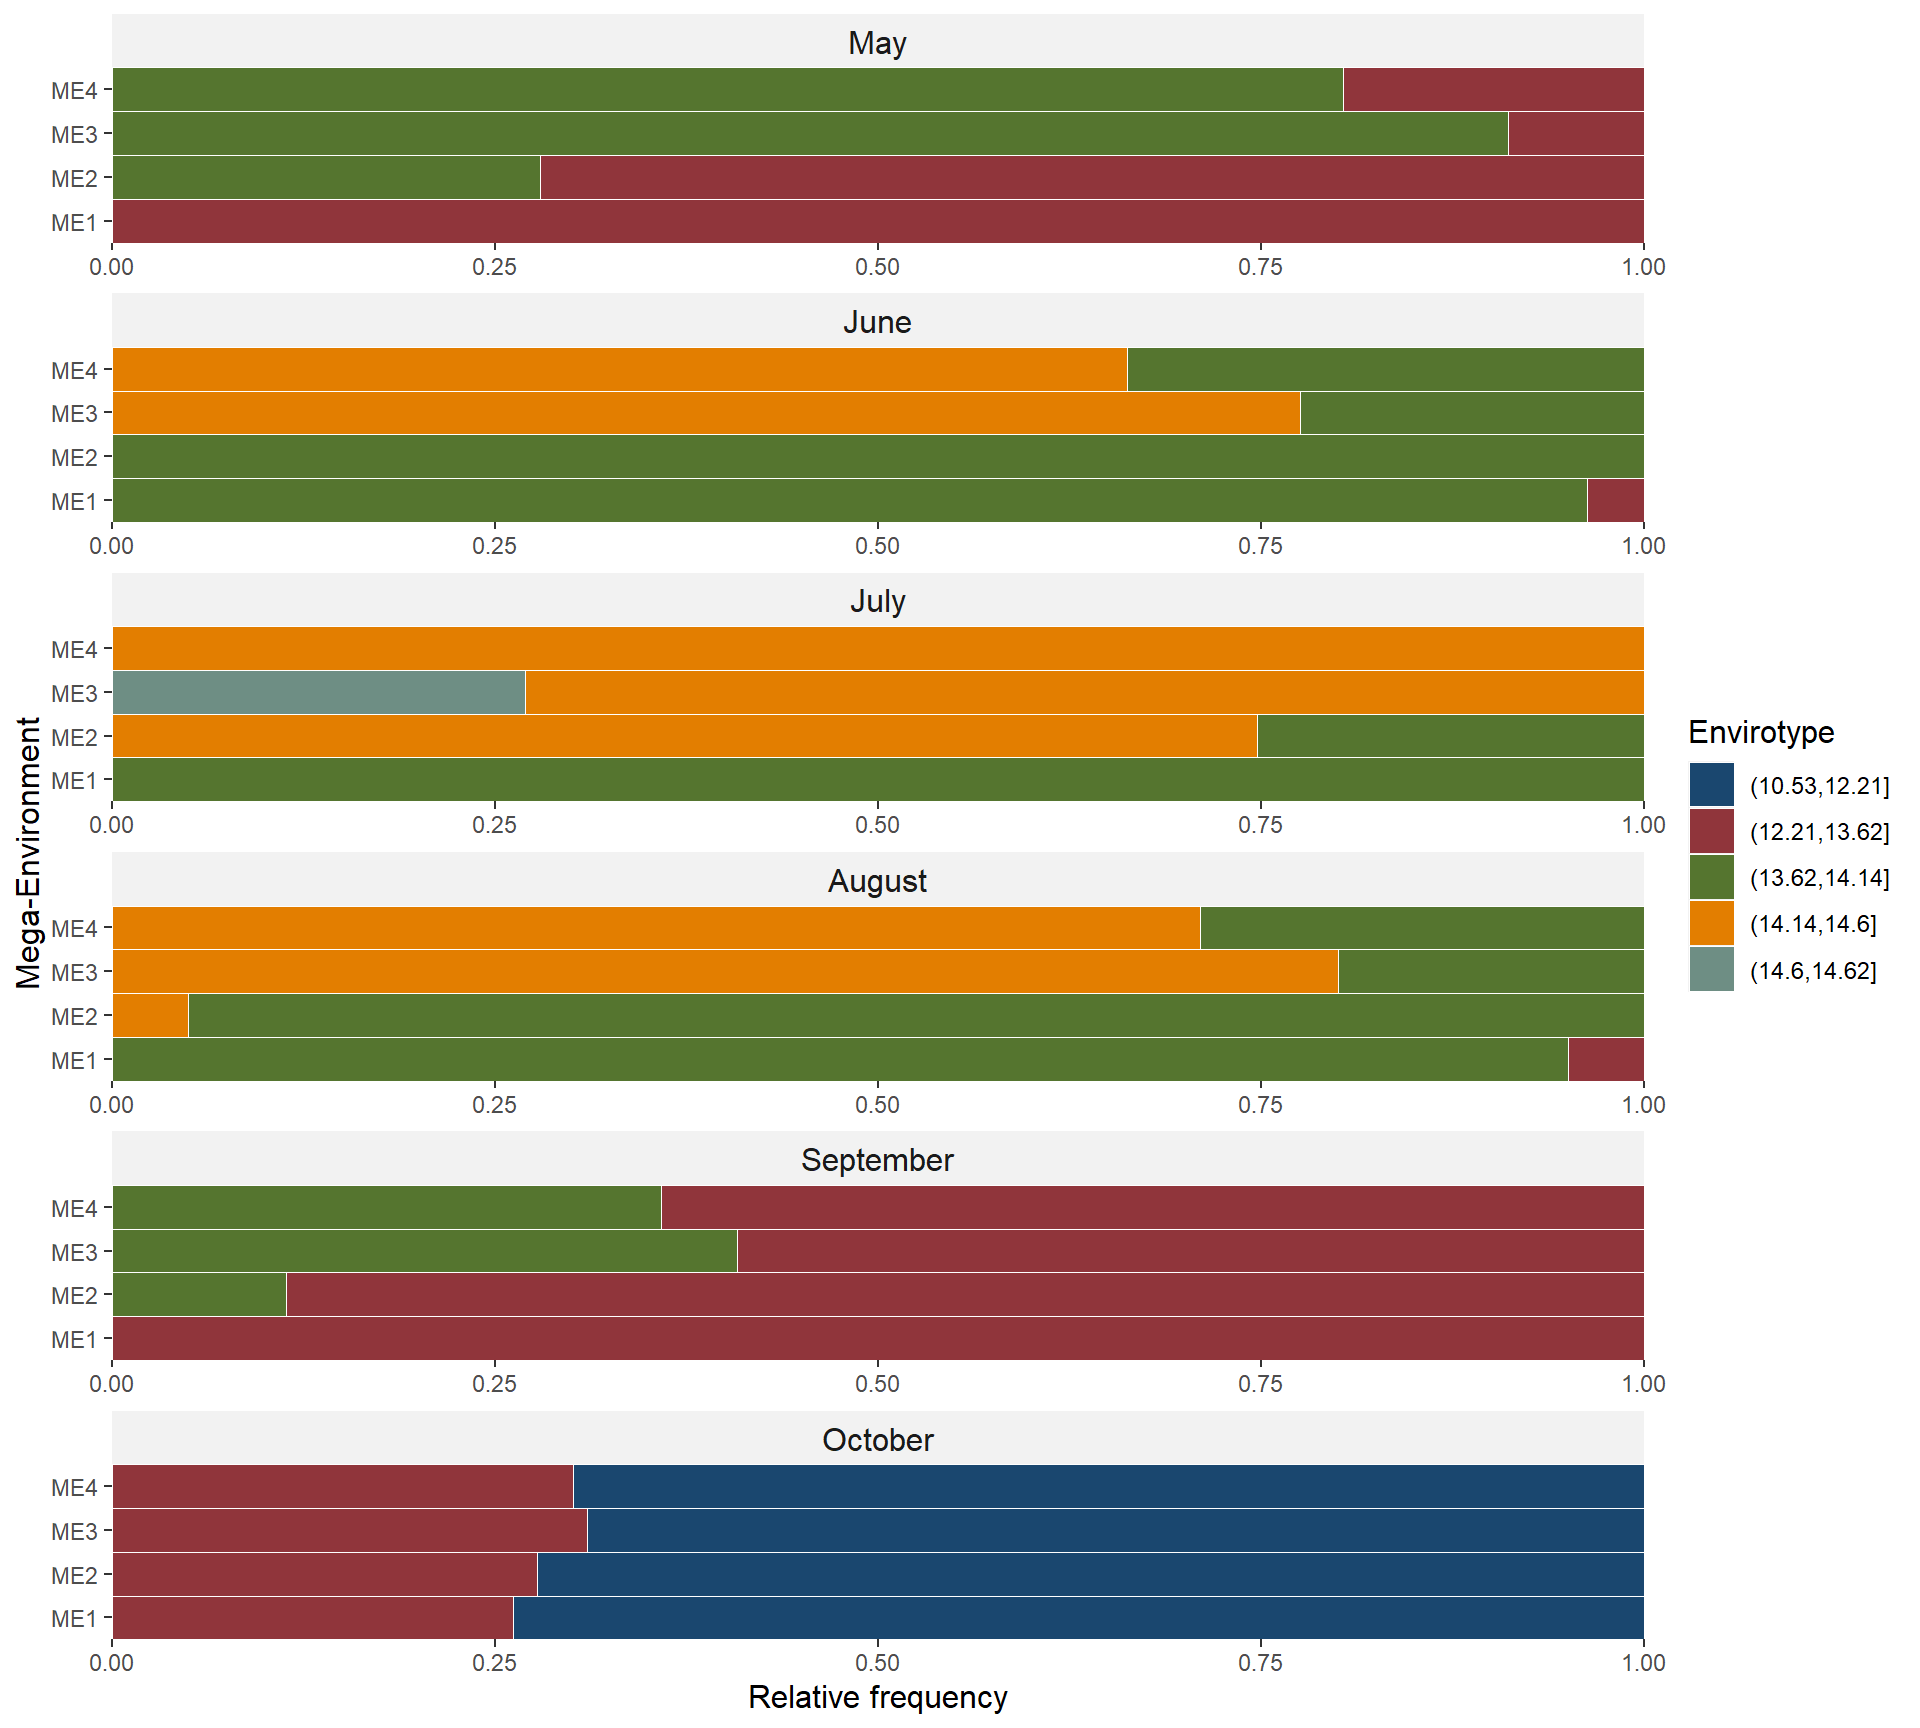
Figure 4: Quantiles for daylight hours over six months observed in the delineated mega-environments
Figure S5
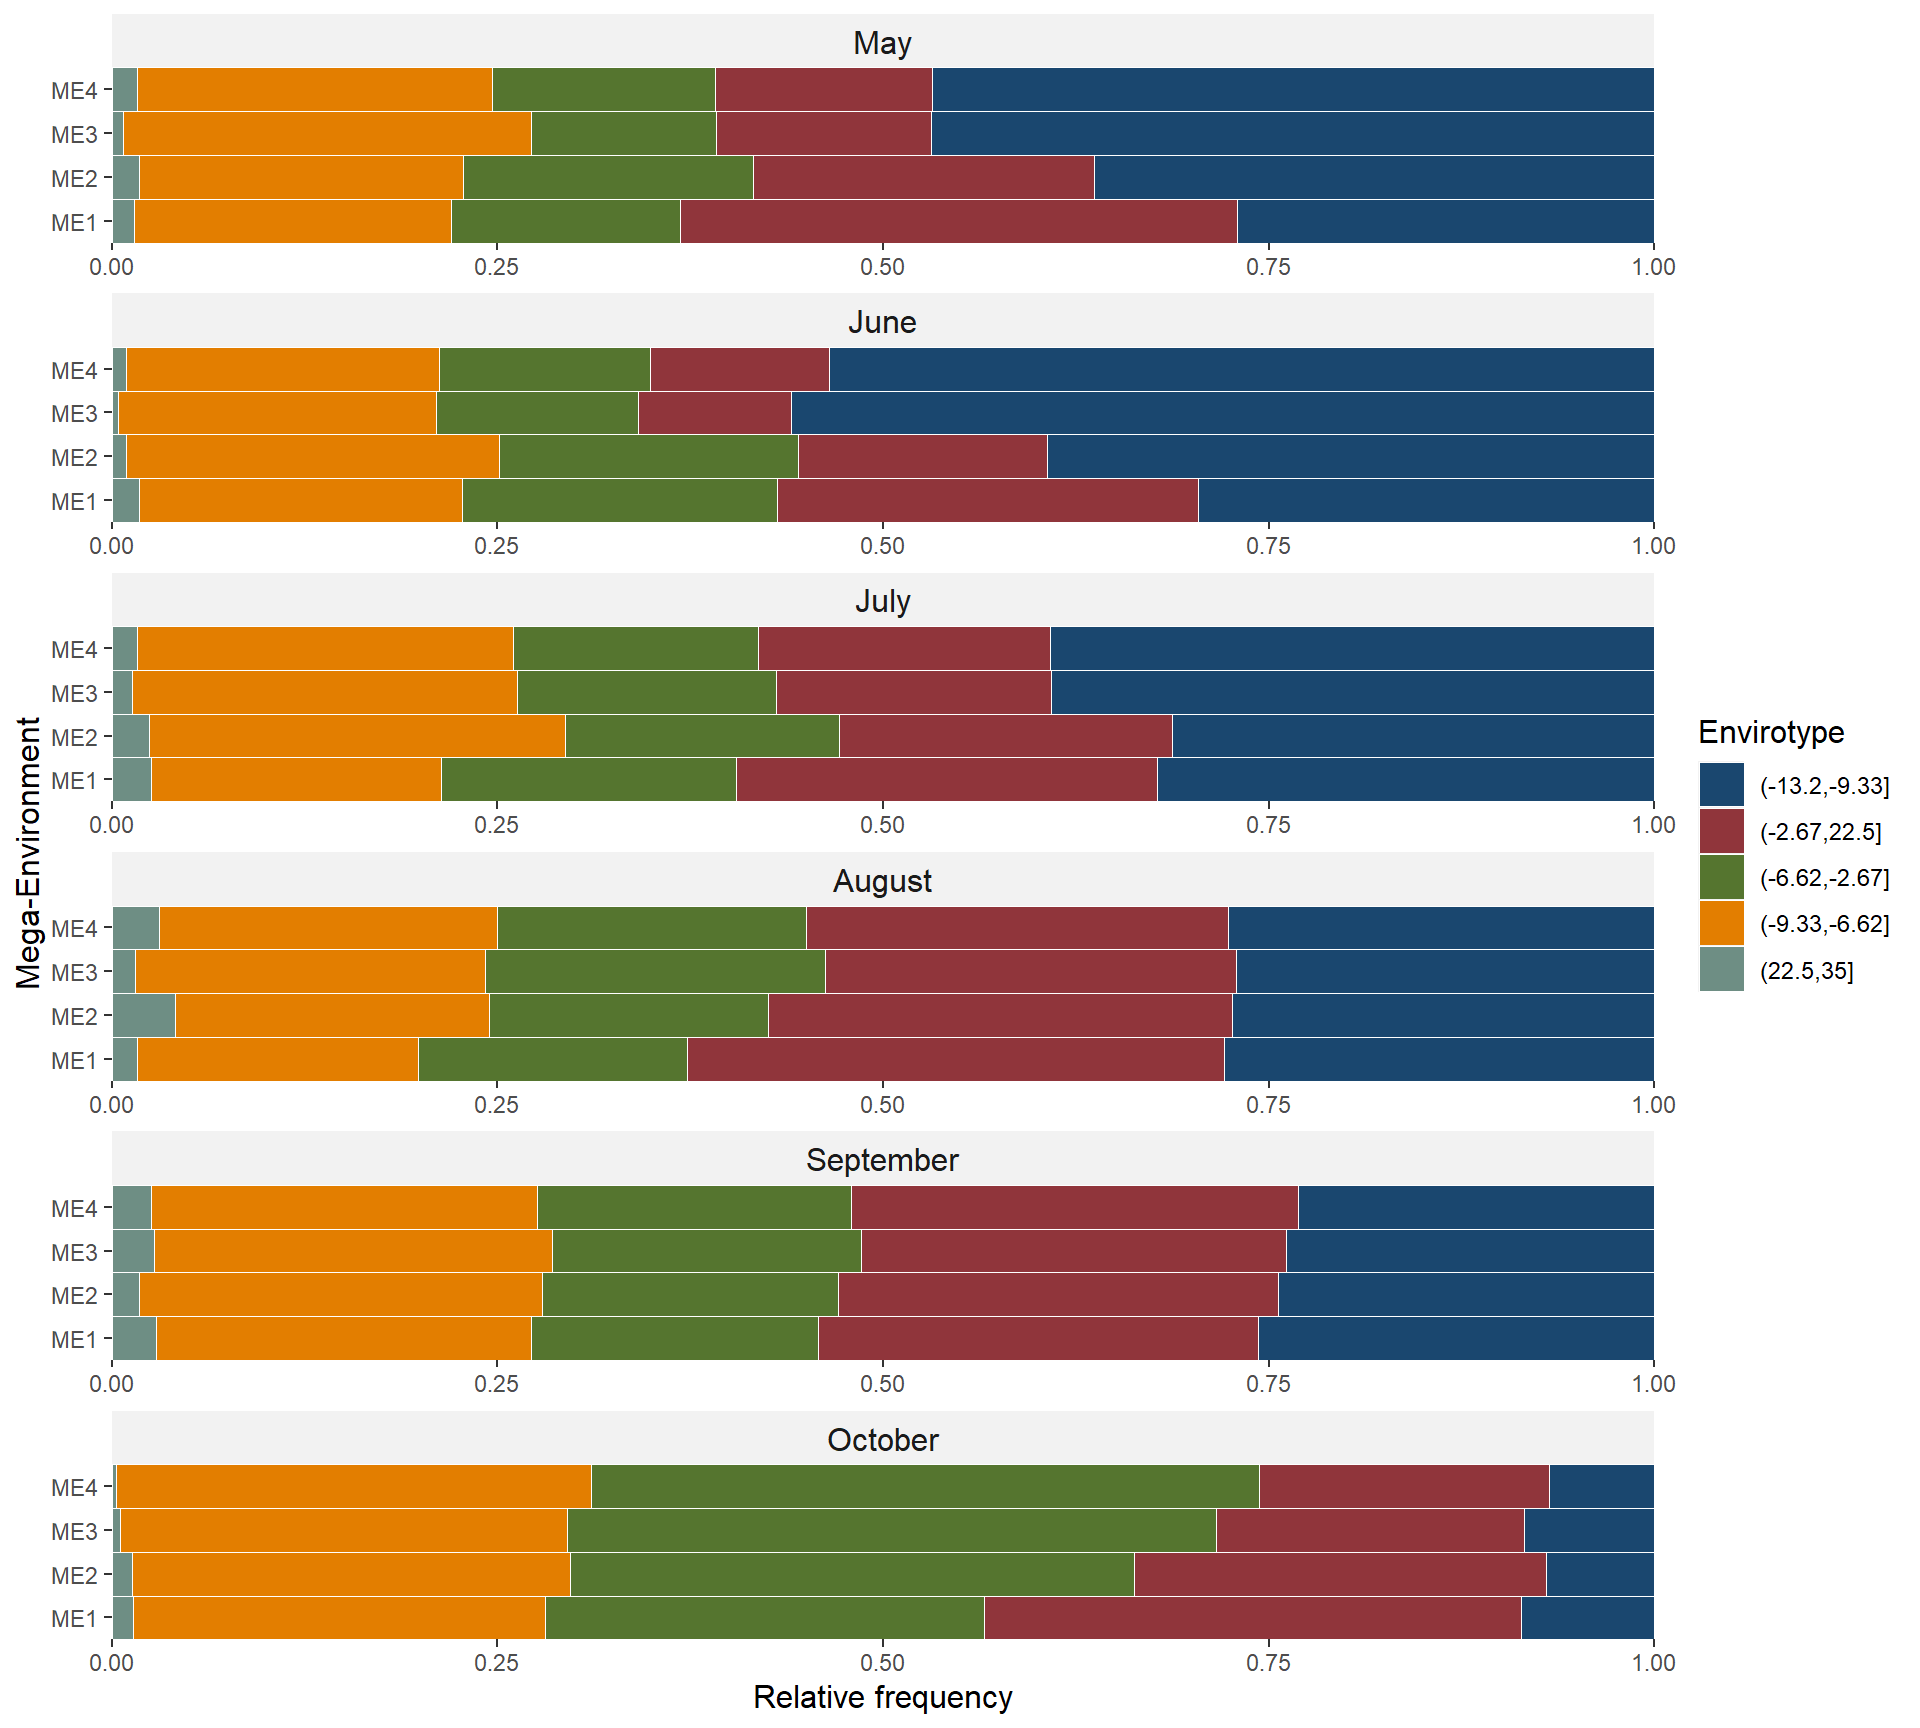
Figure 5: Quantiles for deficit by precipitation over six months observed in the delineated mega-environments
Figure S6
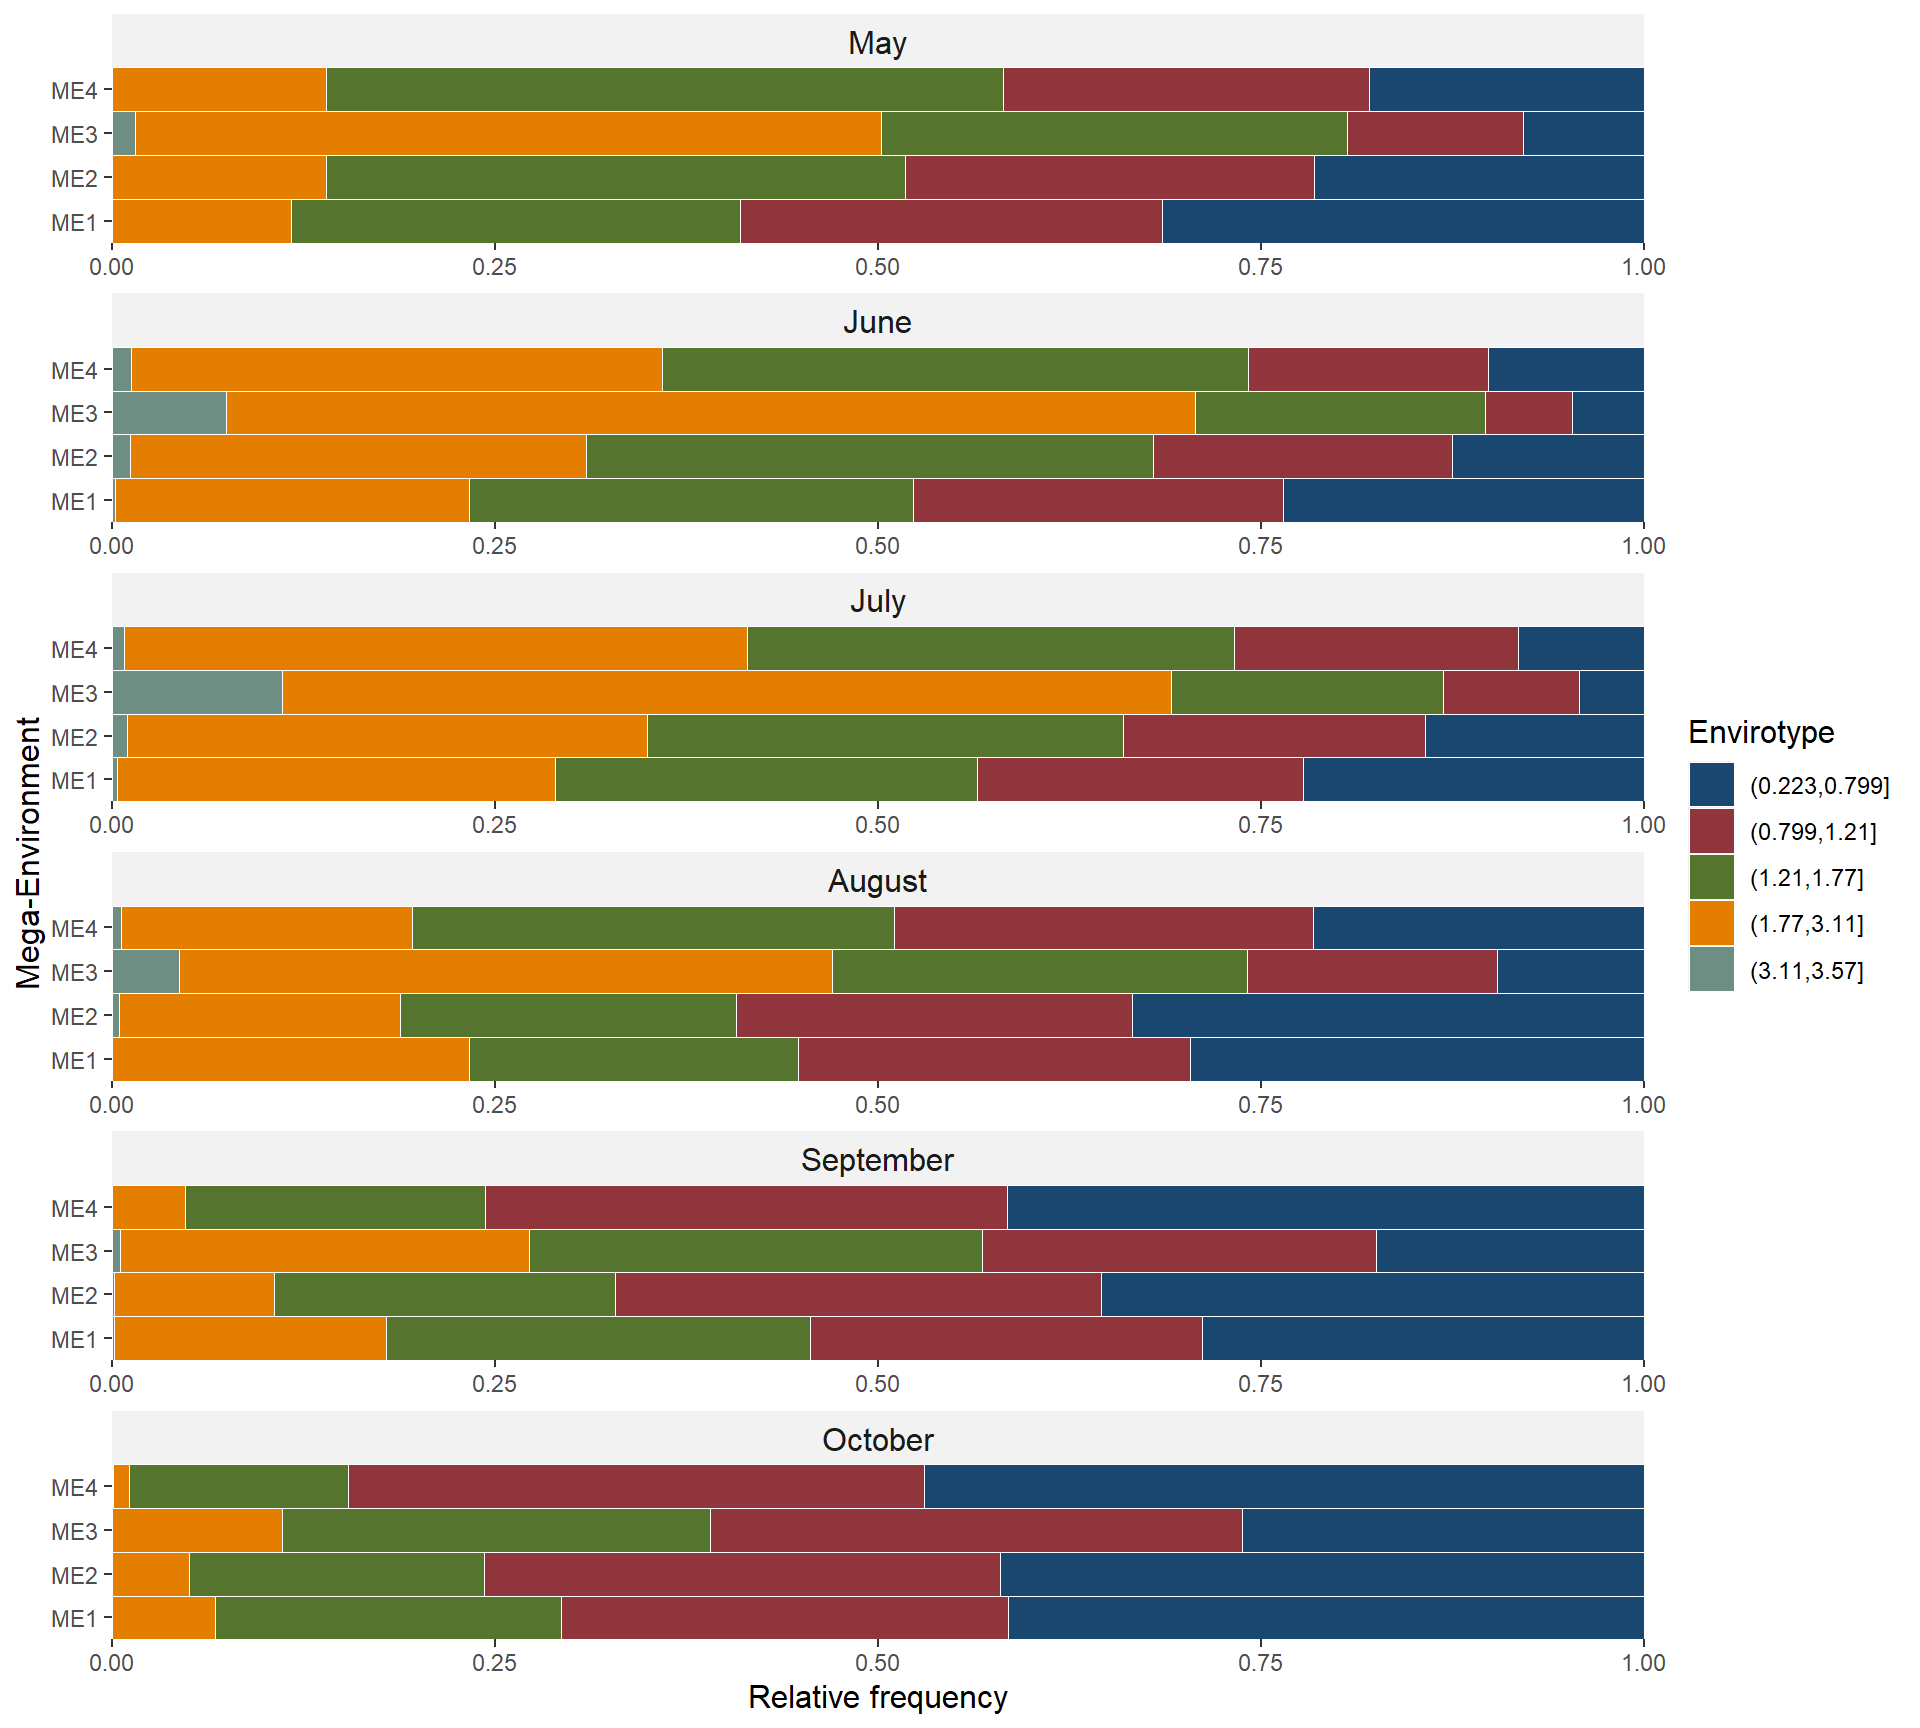
Figure 6: Quantiles for vapor pressure deficit over six months observed in the delineated mega-environments
Figure S7
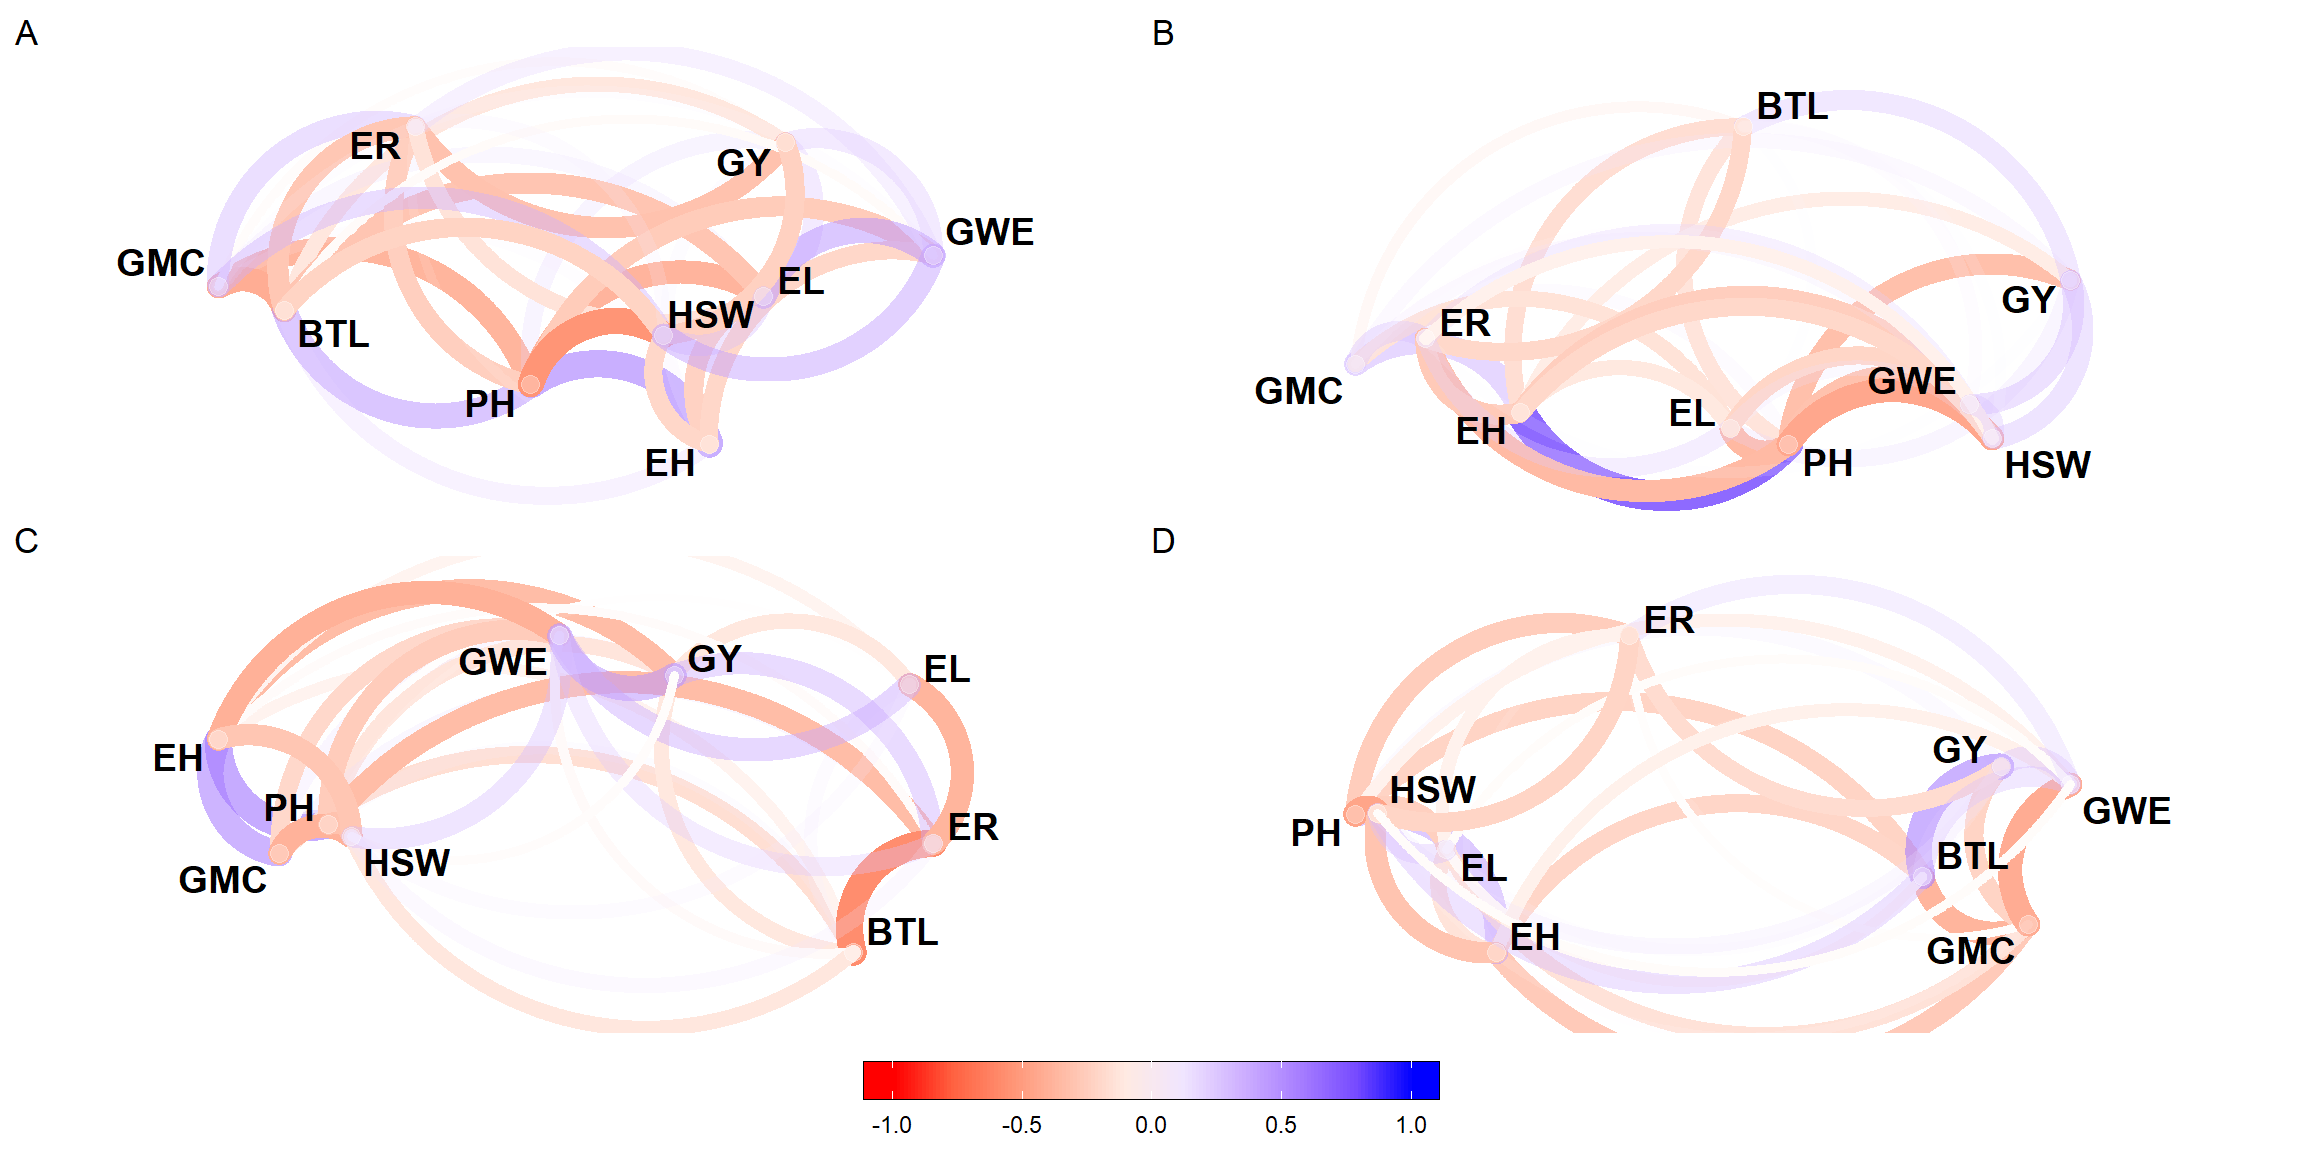
Figure 7: Phenotypic correlation between the studied traits within ME1 (A), ME2 (B), and ME3 (C), and ME4 (D).
Figure S8
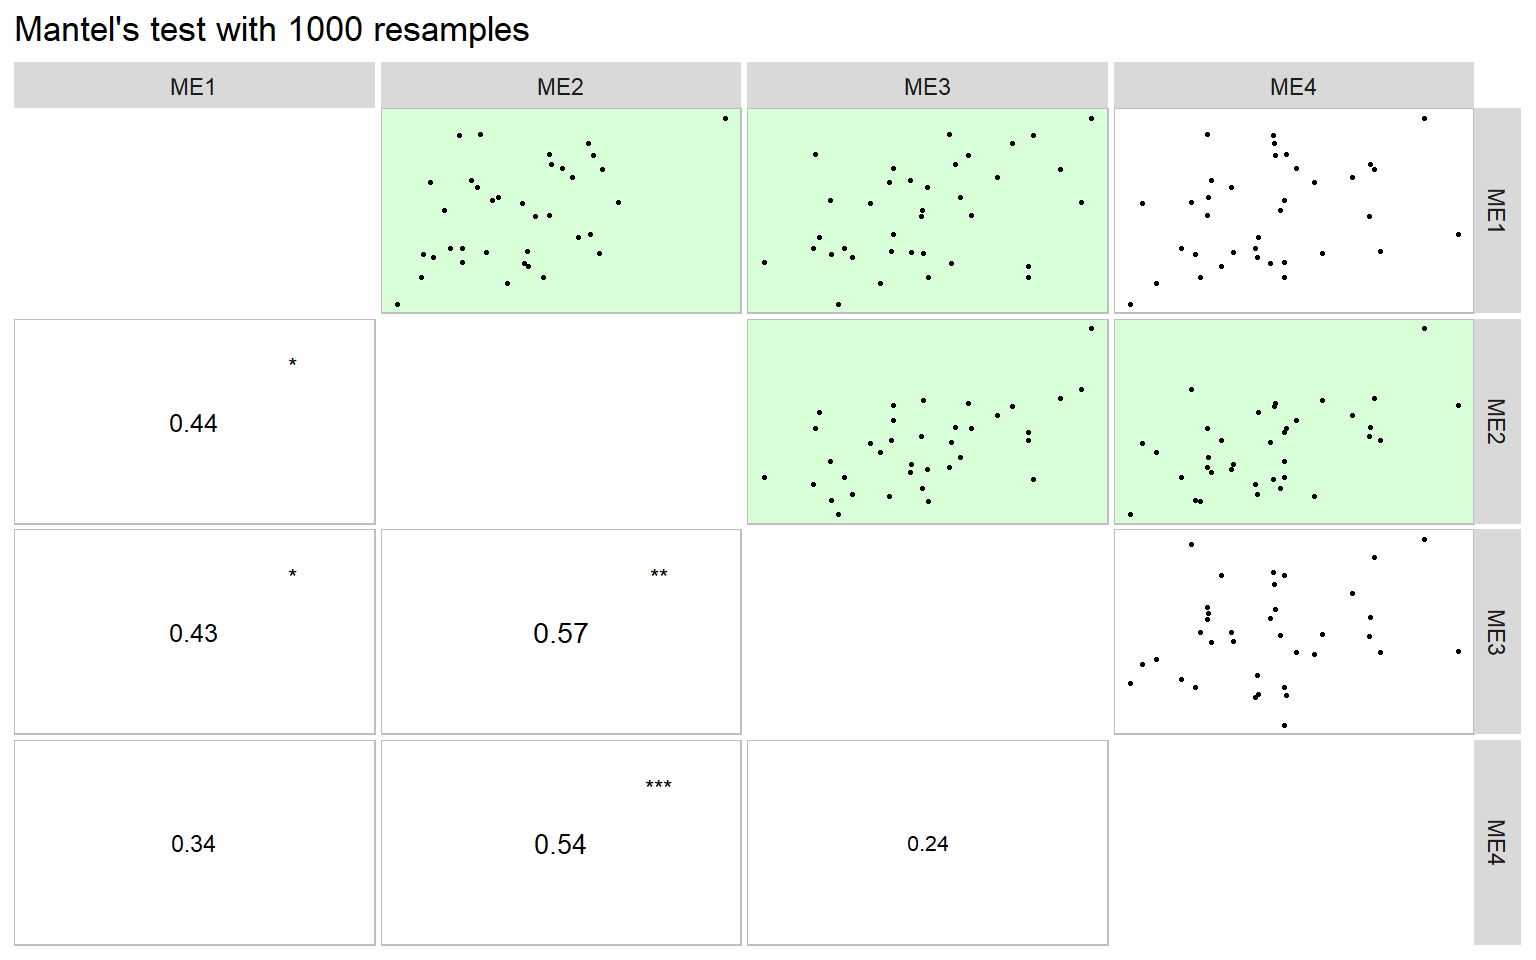
Figure 8: Mantel’s correlation between the phenotypic correlation matrices observed in each mega-environment
Figure S9
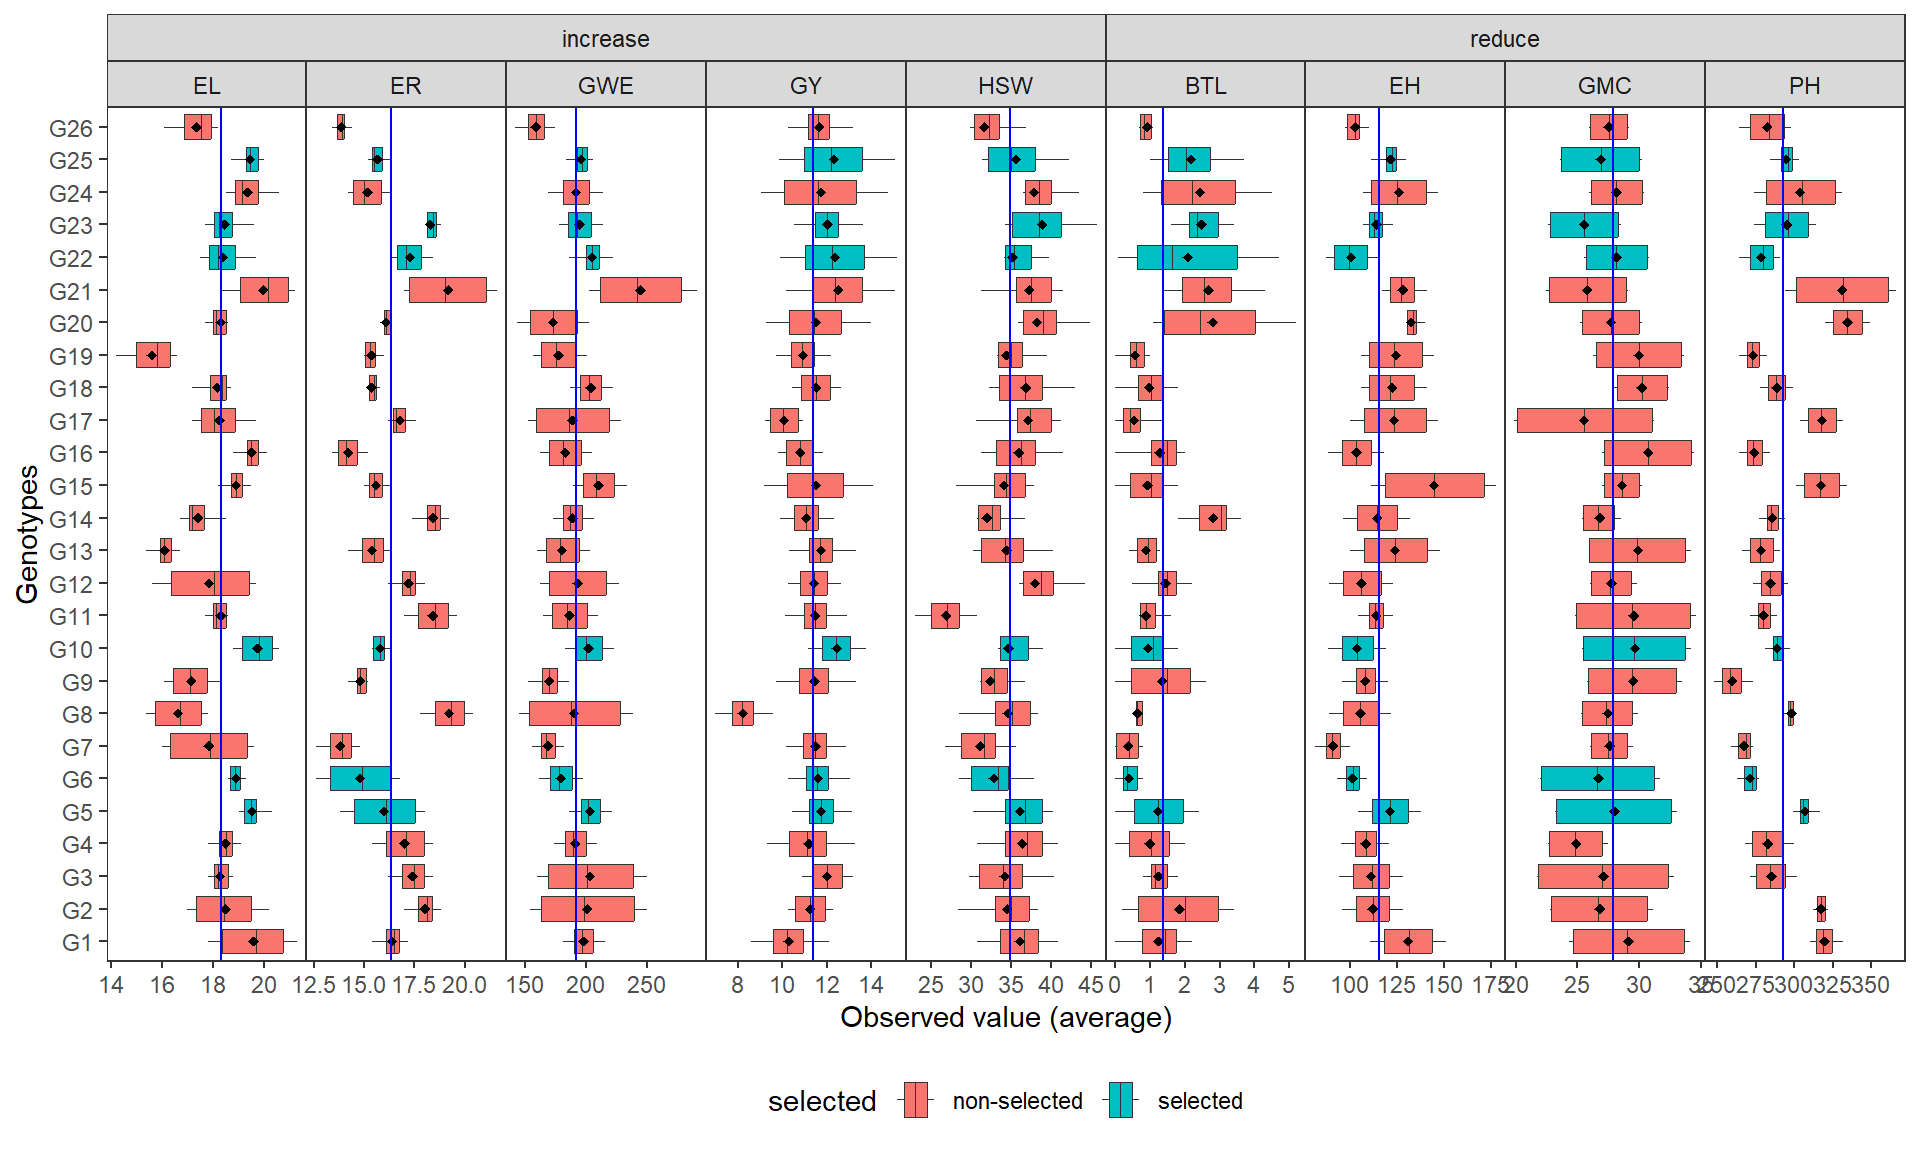
Figure 9: Average value for the studied trait across ME1
Figure S10
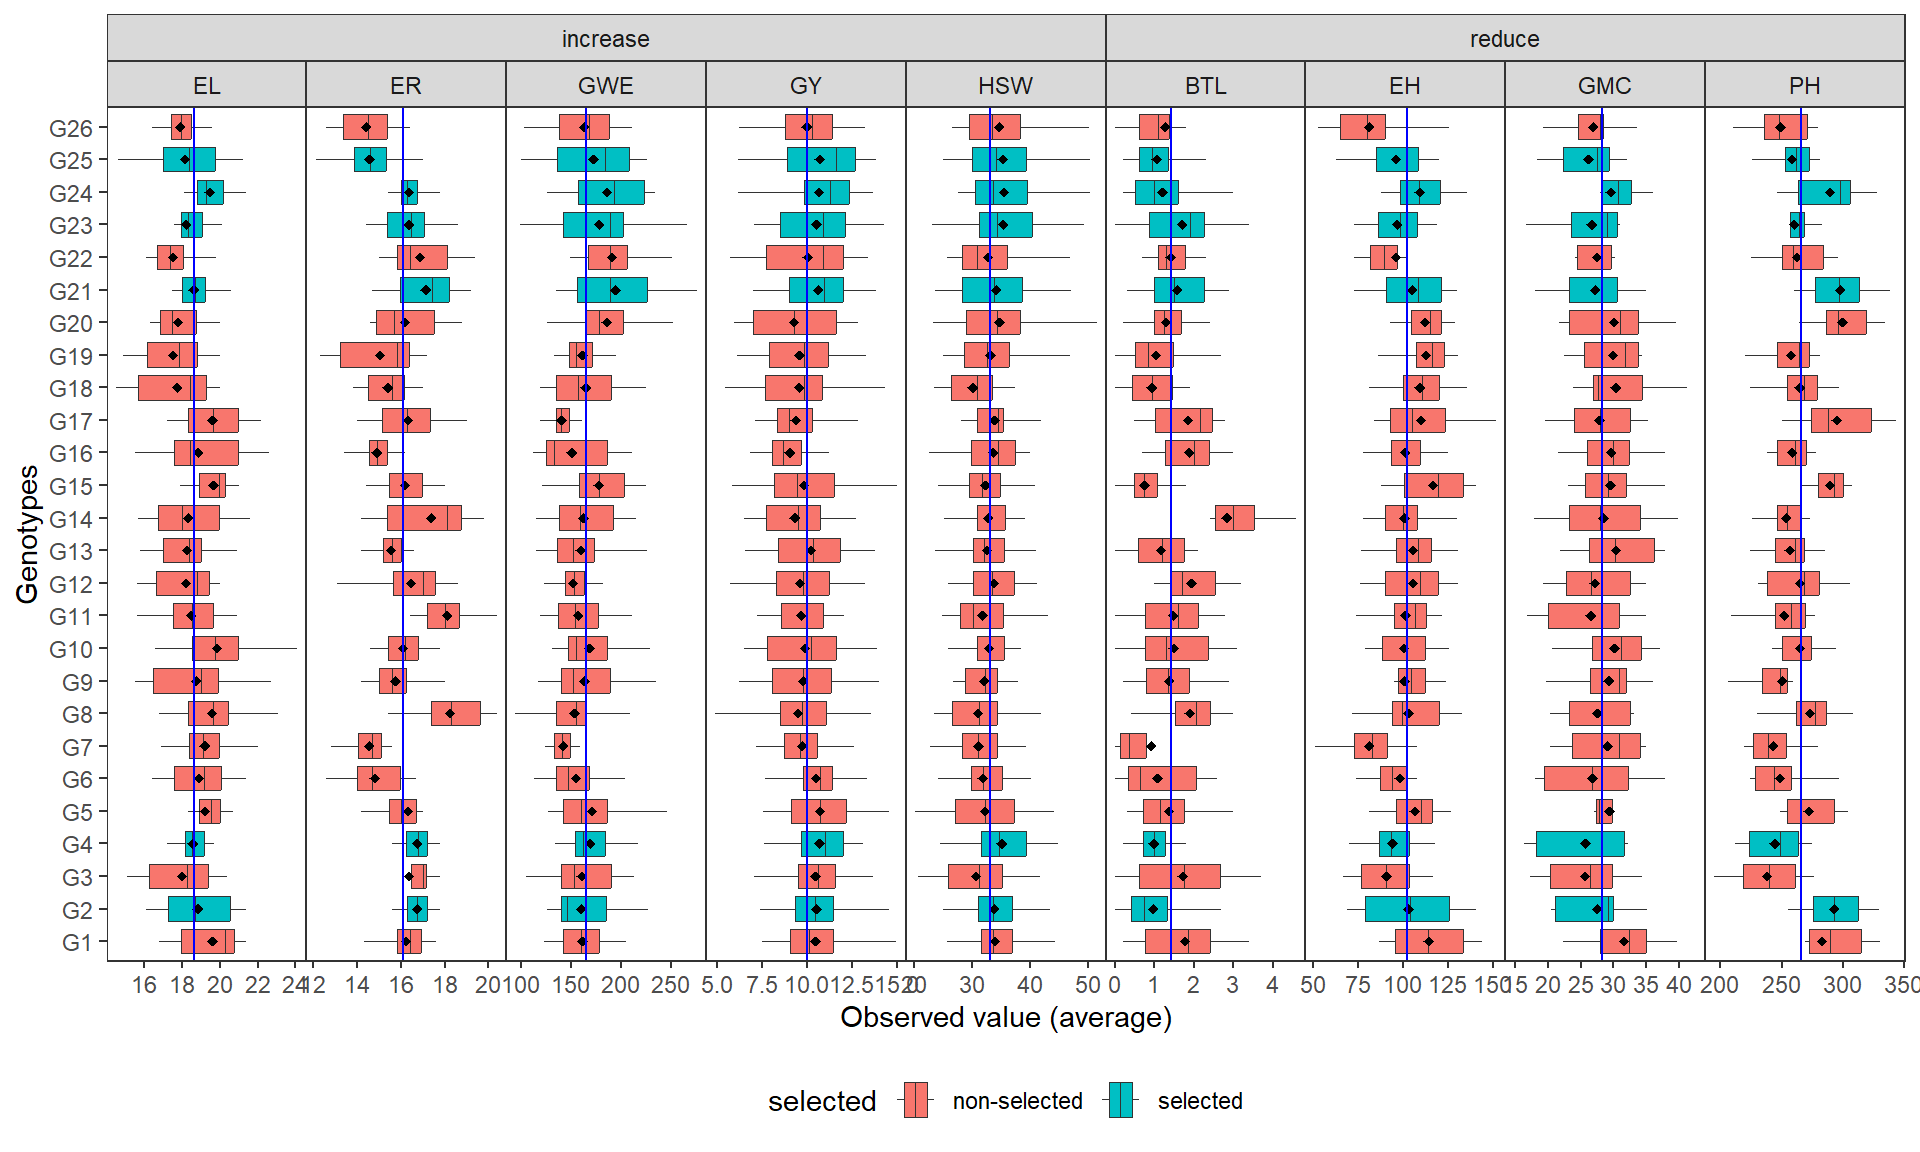
Figure 10: Average value for the studied trait across ME2
Figure S11
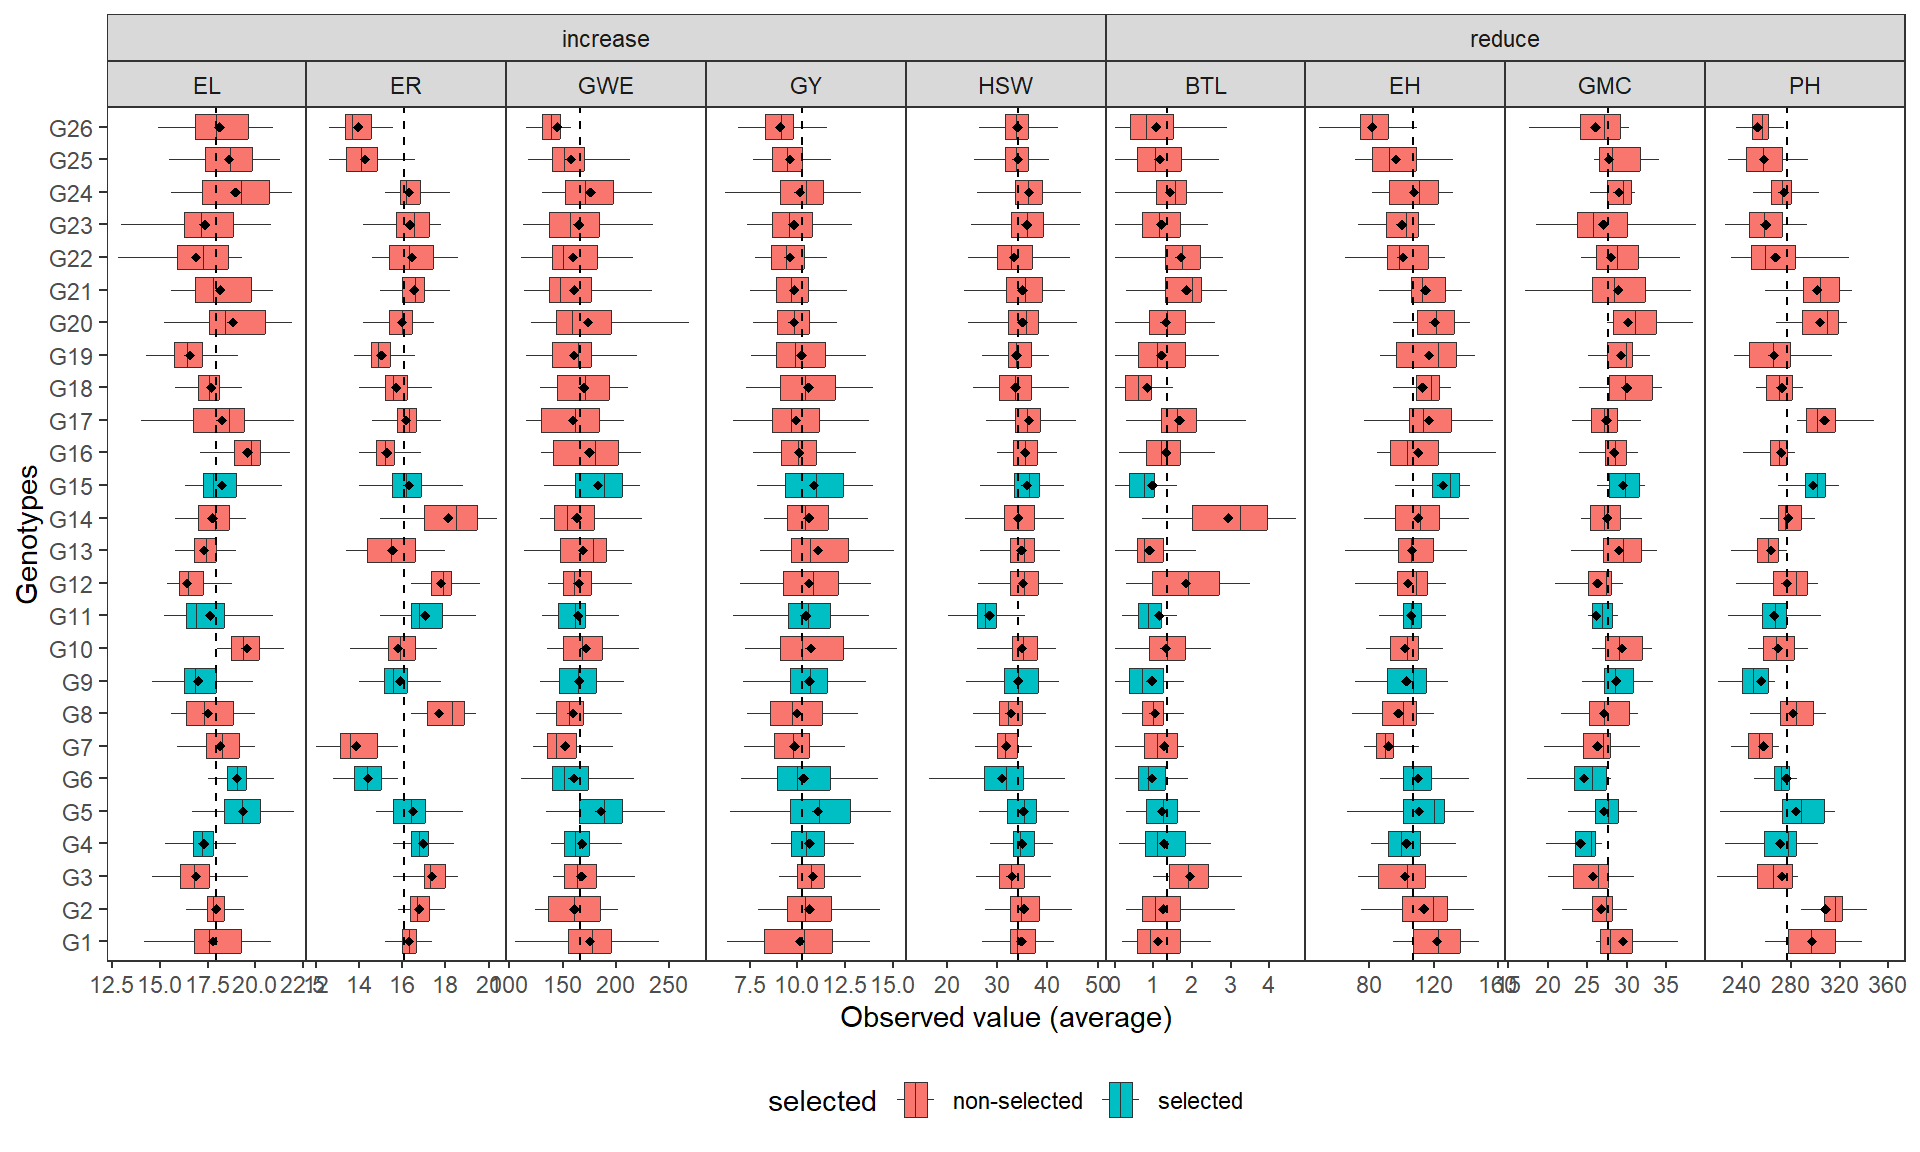
Figure 11: Average value for the studied trait across ME3
Figure S12
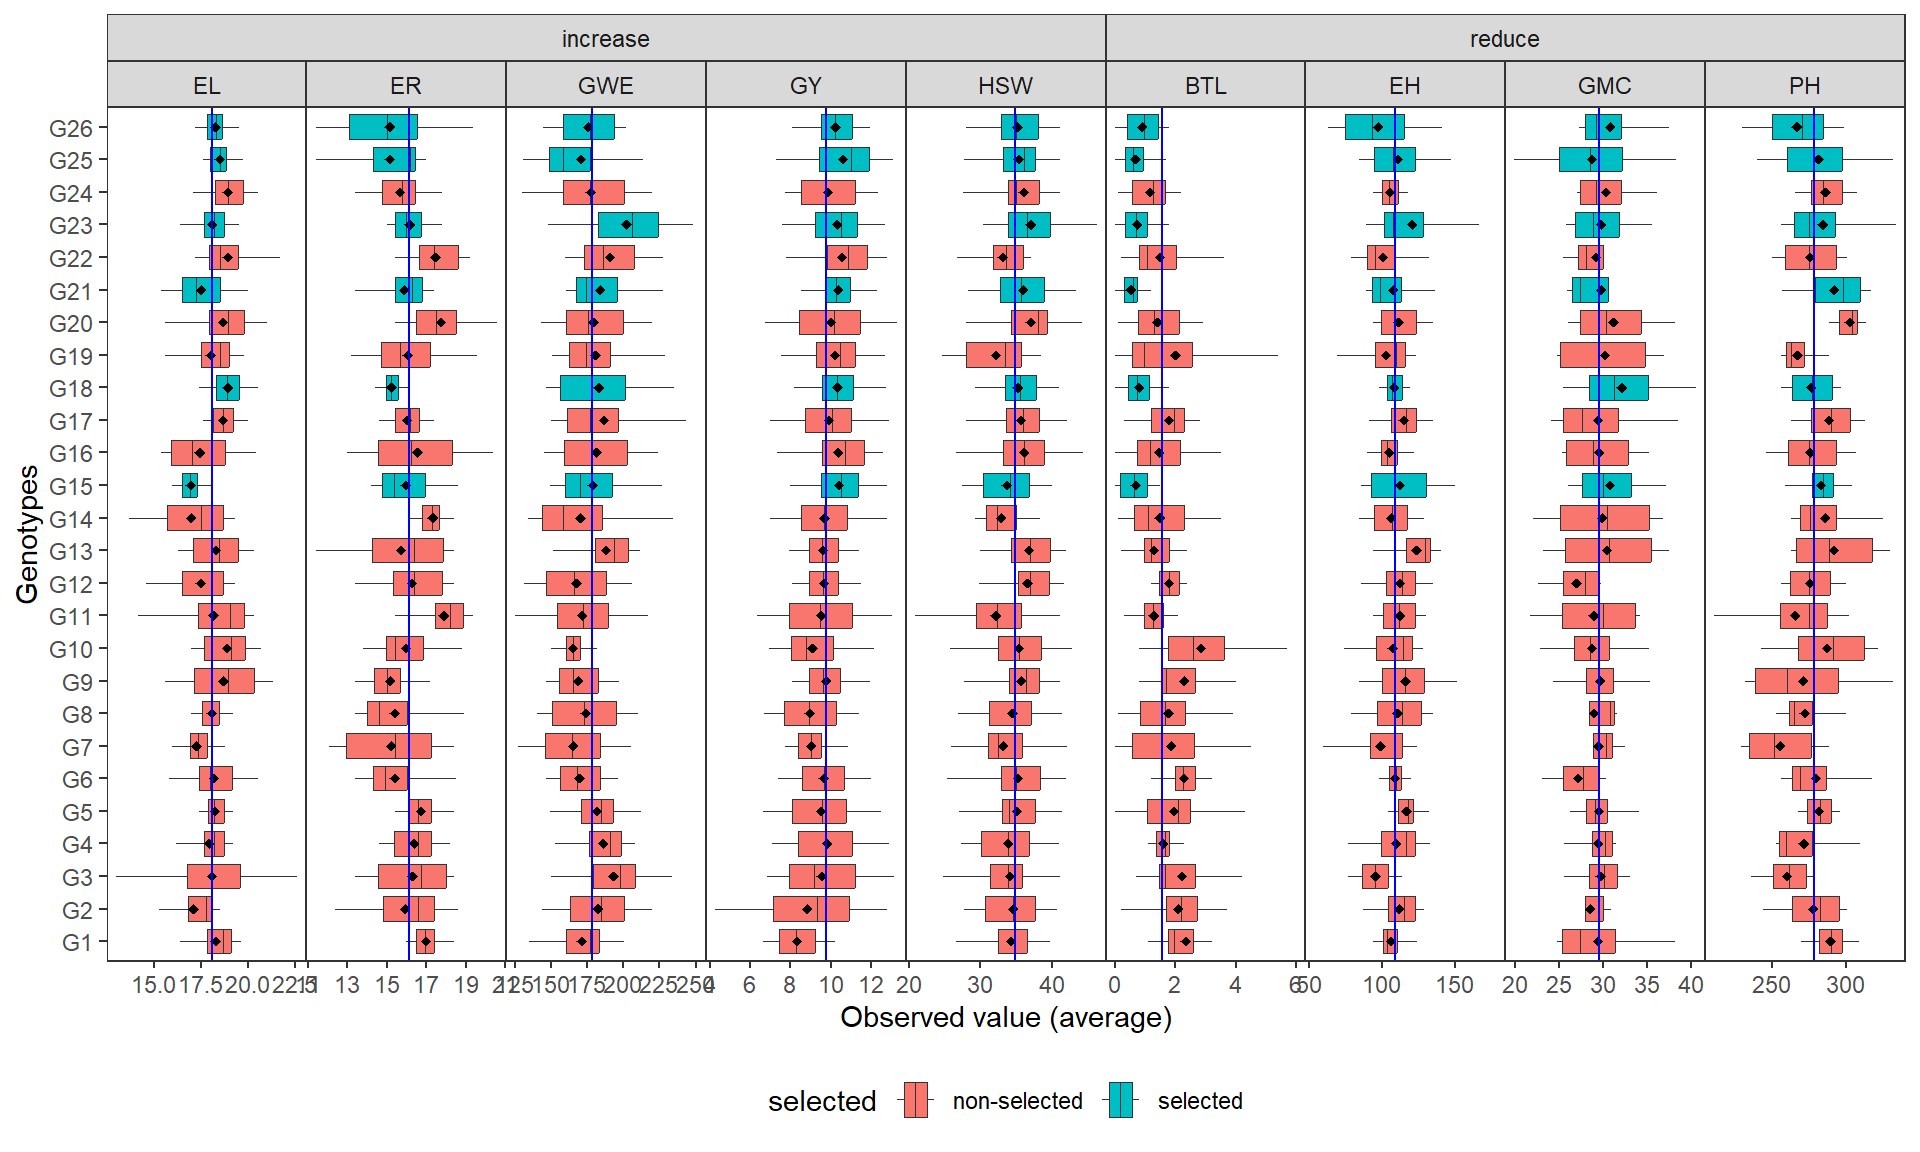
Figure 12: Average value for the studied trait across ME4
Figure S13
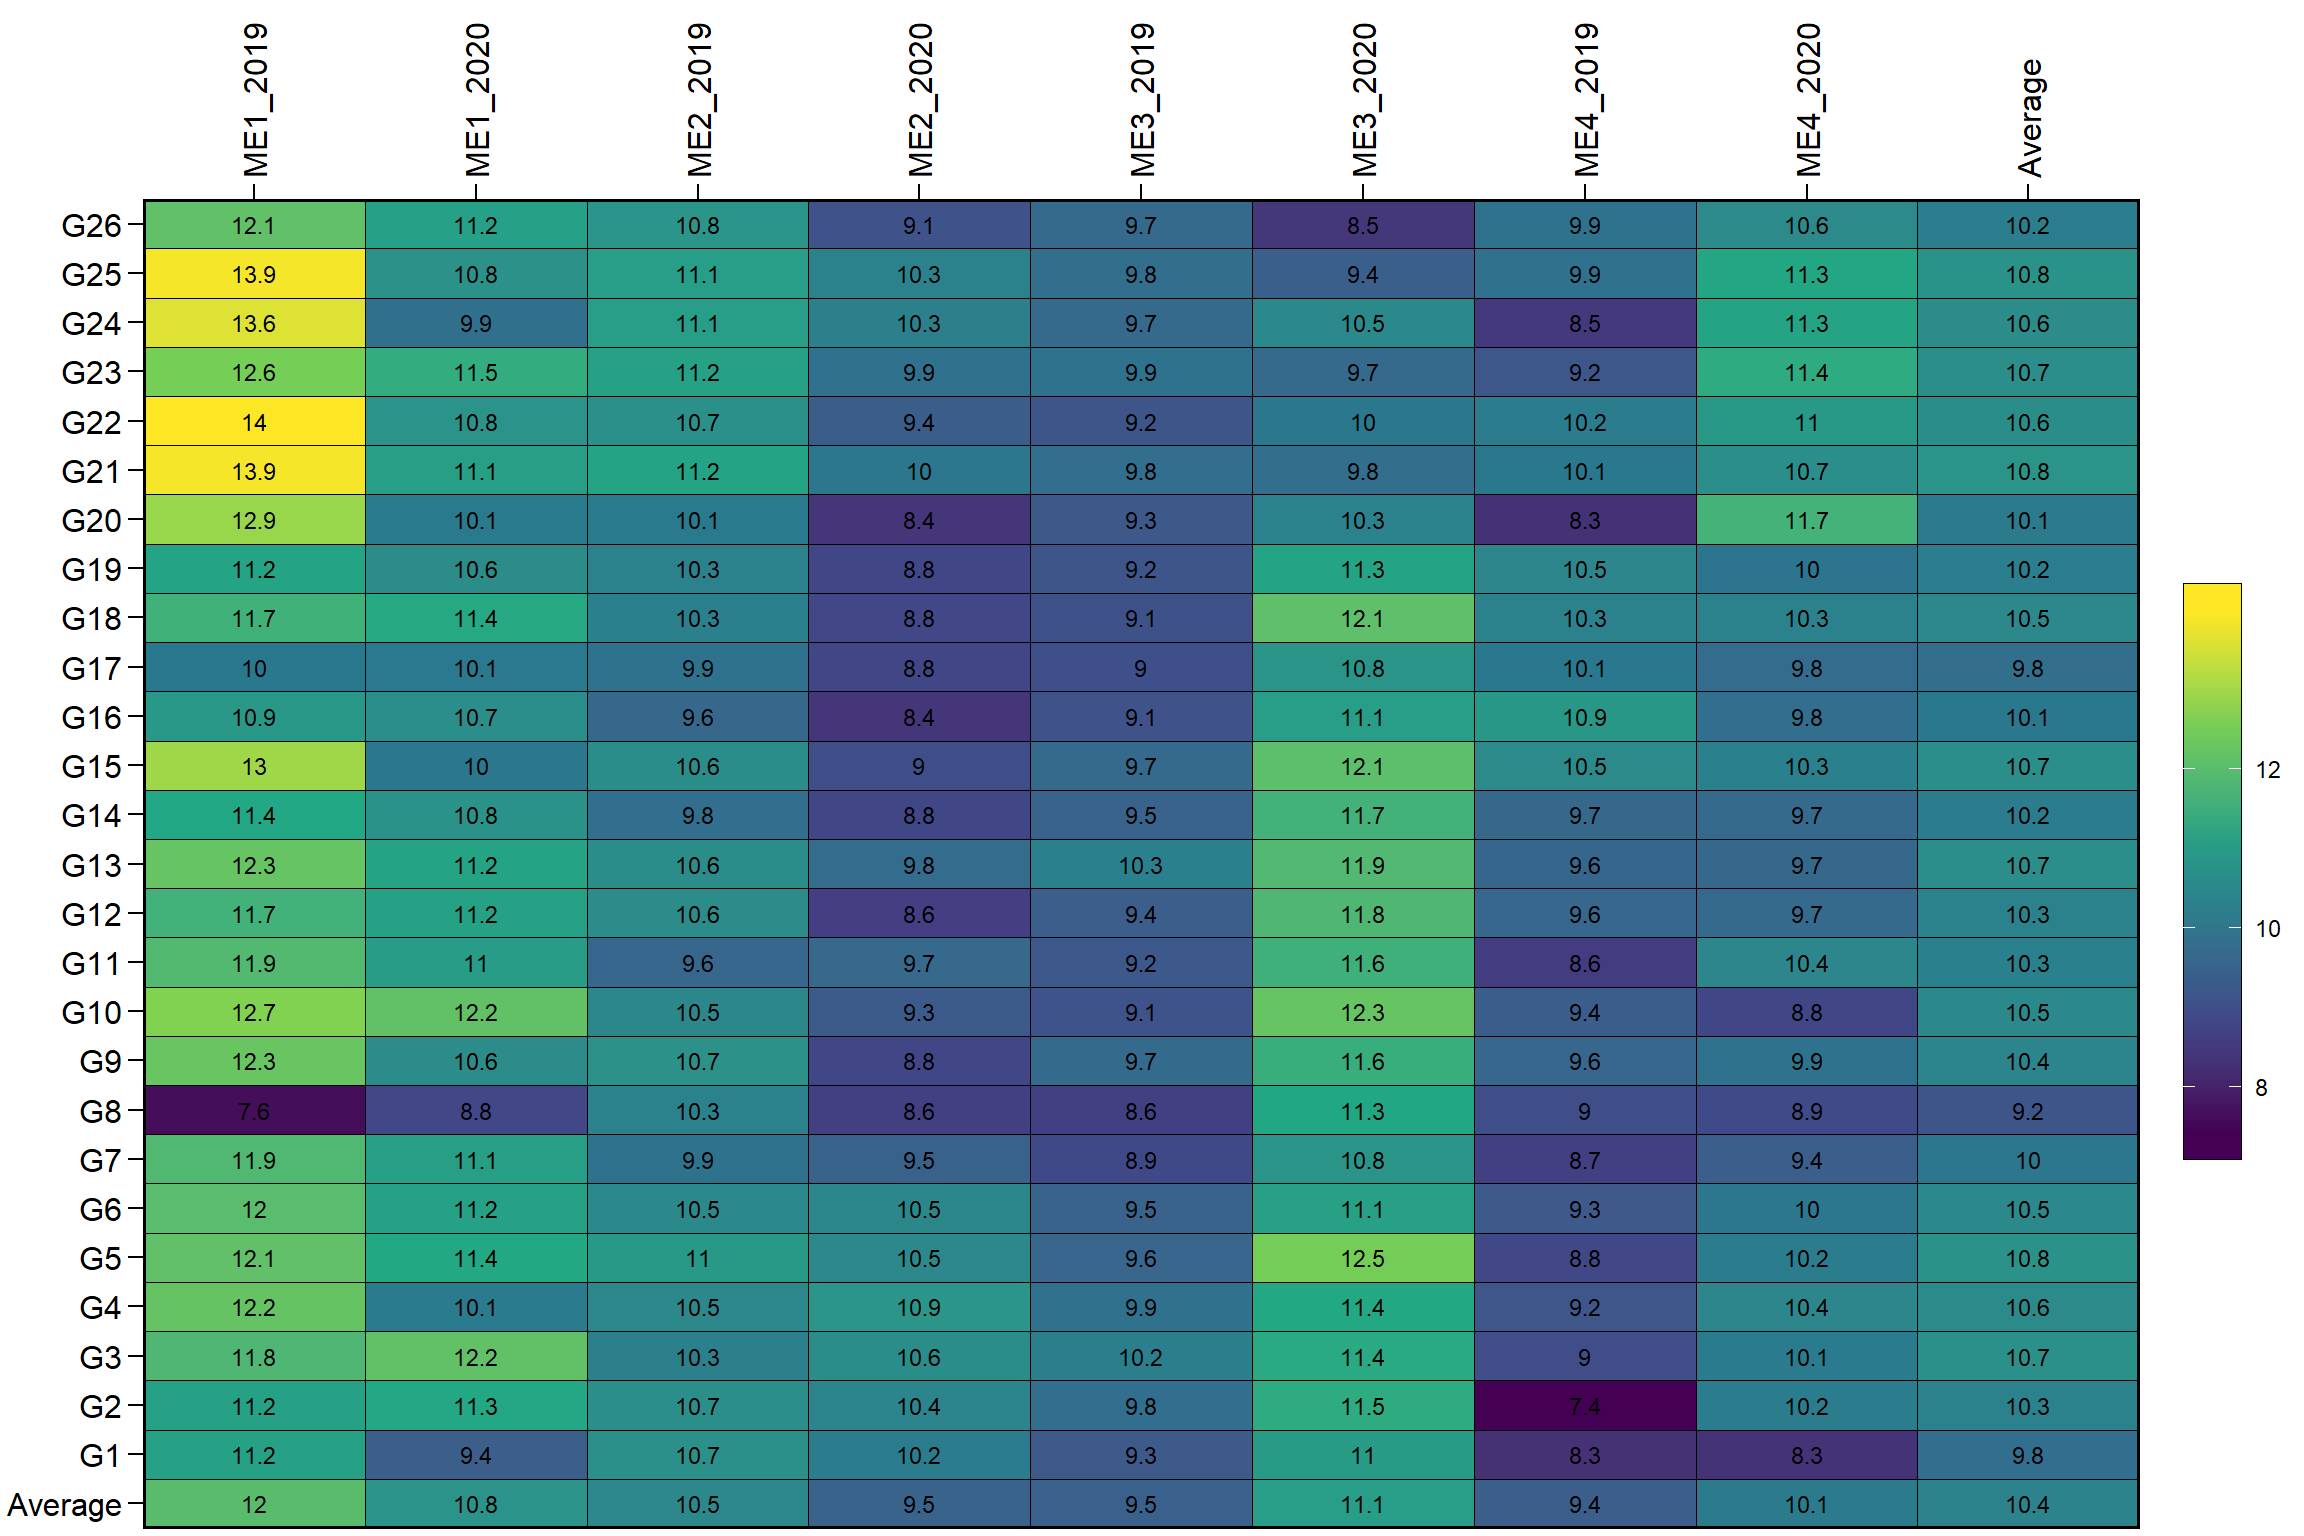
Figure 13: Heatmap showing the average yield of the studied genotypes in each combination of mega-environment and year
Figure S14
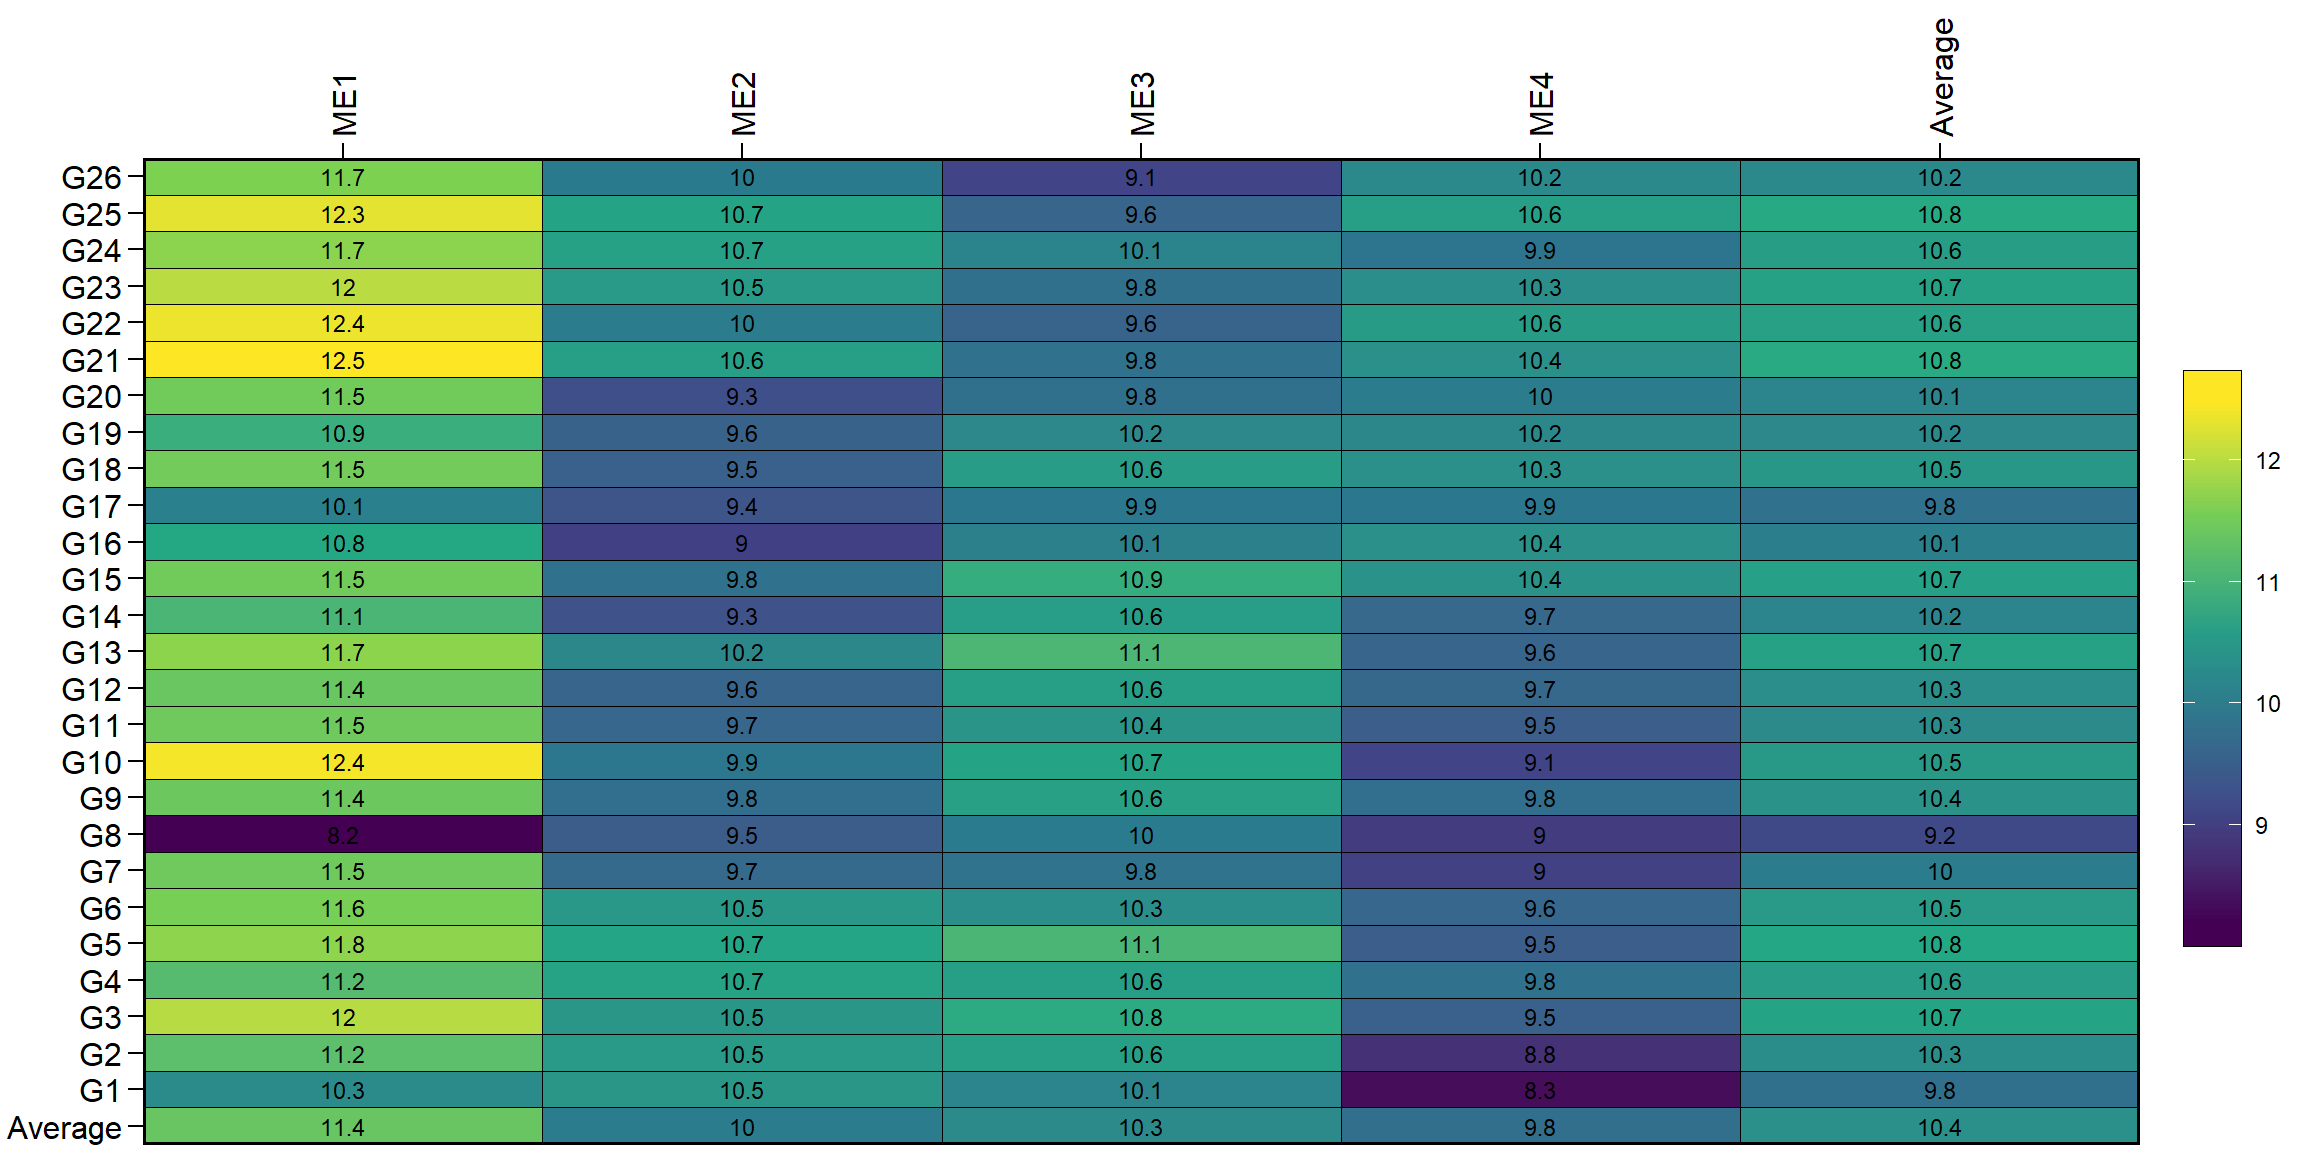
Figure 14: Heatmap showing the average yield of the studied genotypes in each mega-environment
Figure S15
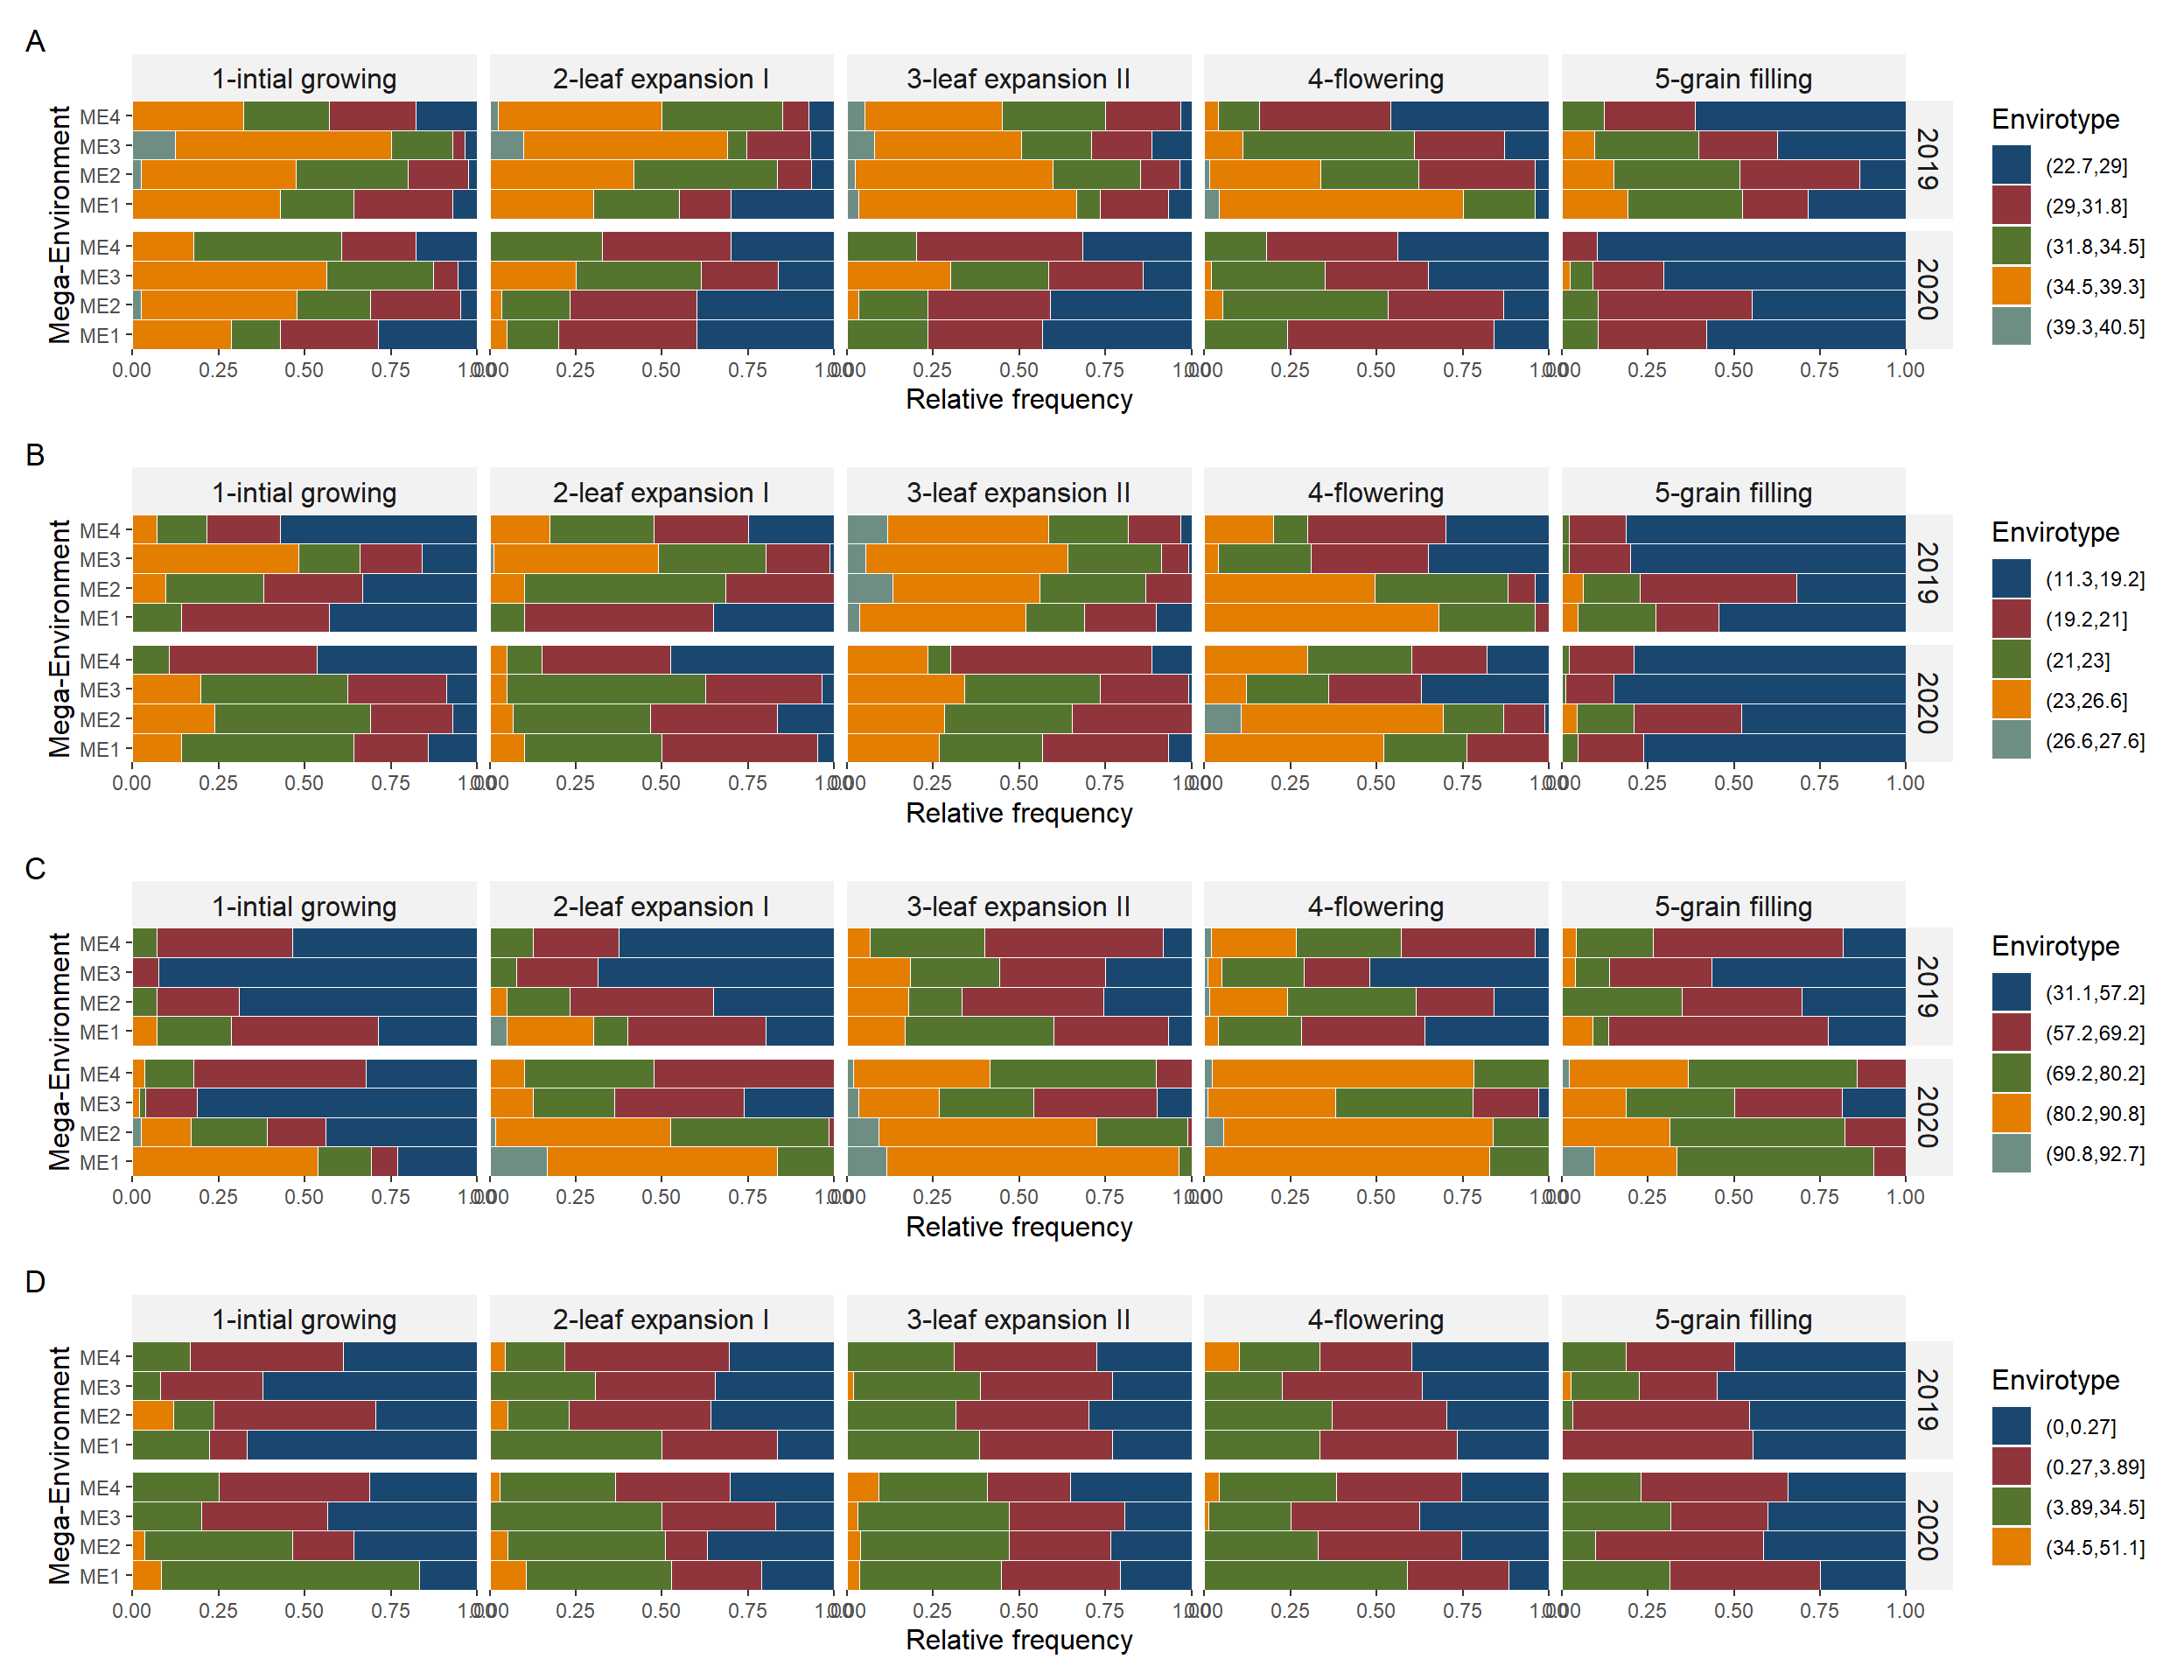
Figure 15: Quantiles for maximum air temperature (A), maximum air temperature (B), relative humidity (C), and rainfall precipitation (D) observed in the studied mega-environments across distinct crop stages and cultivation years.
Figure S16
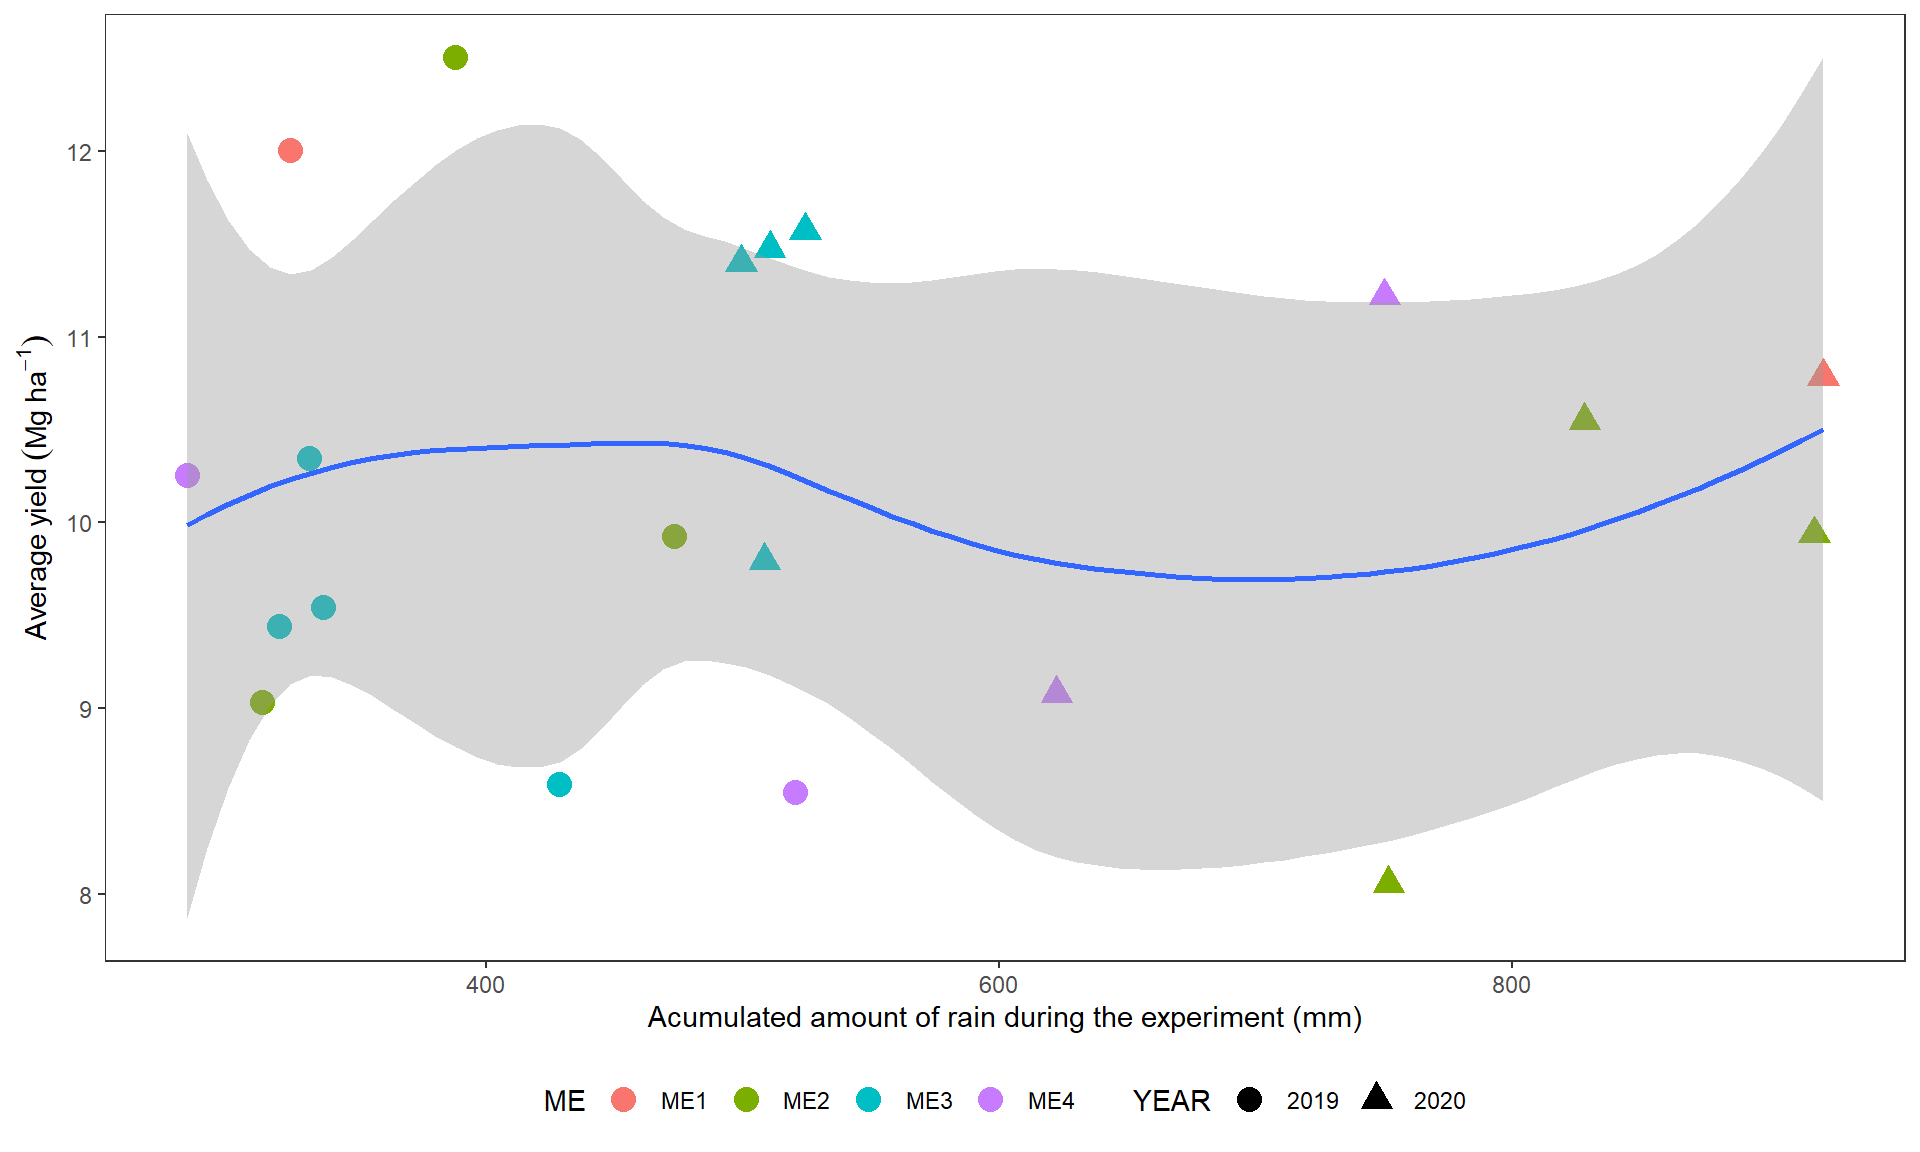
Figure 16: Relationhips between accumulated rainfall precipitation and grain yield. The different colors shows the mega-environments and the different shapes, the cultivation year.
Figure S17
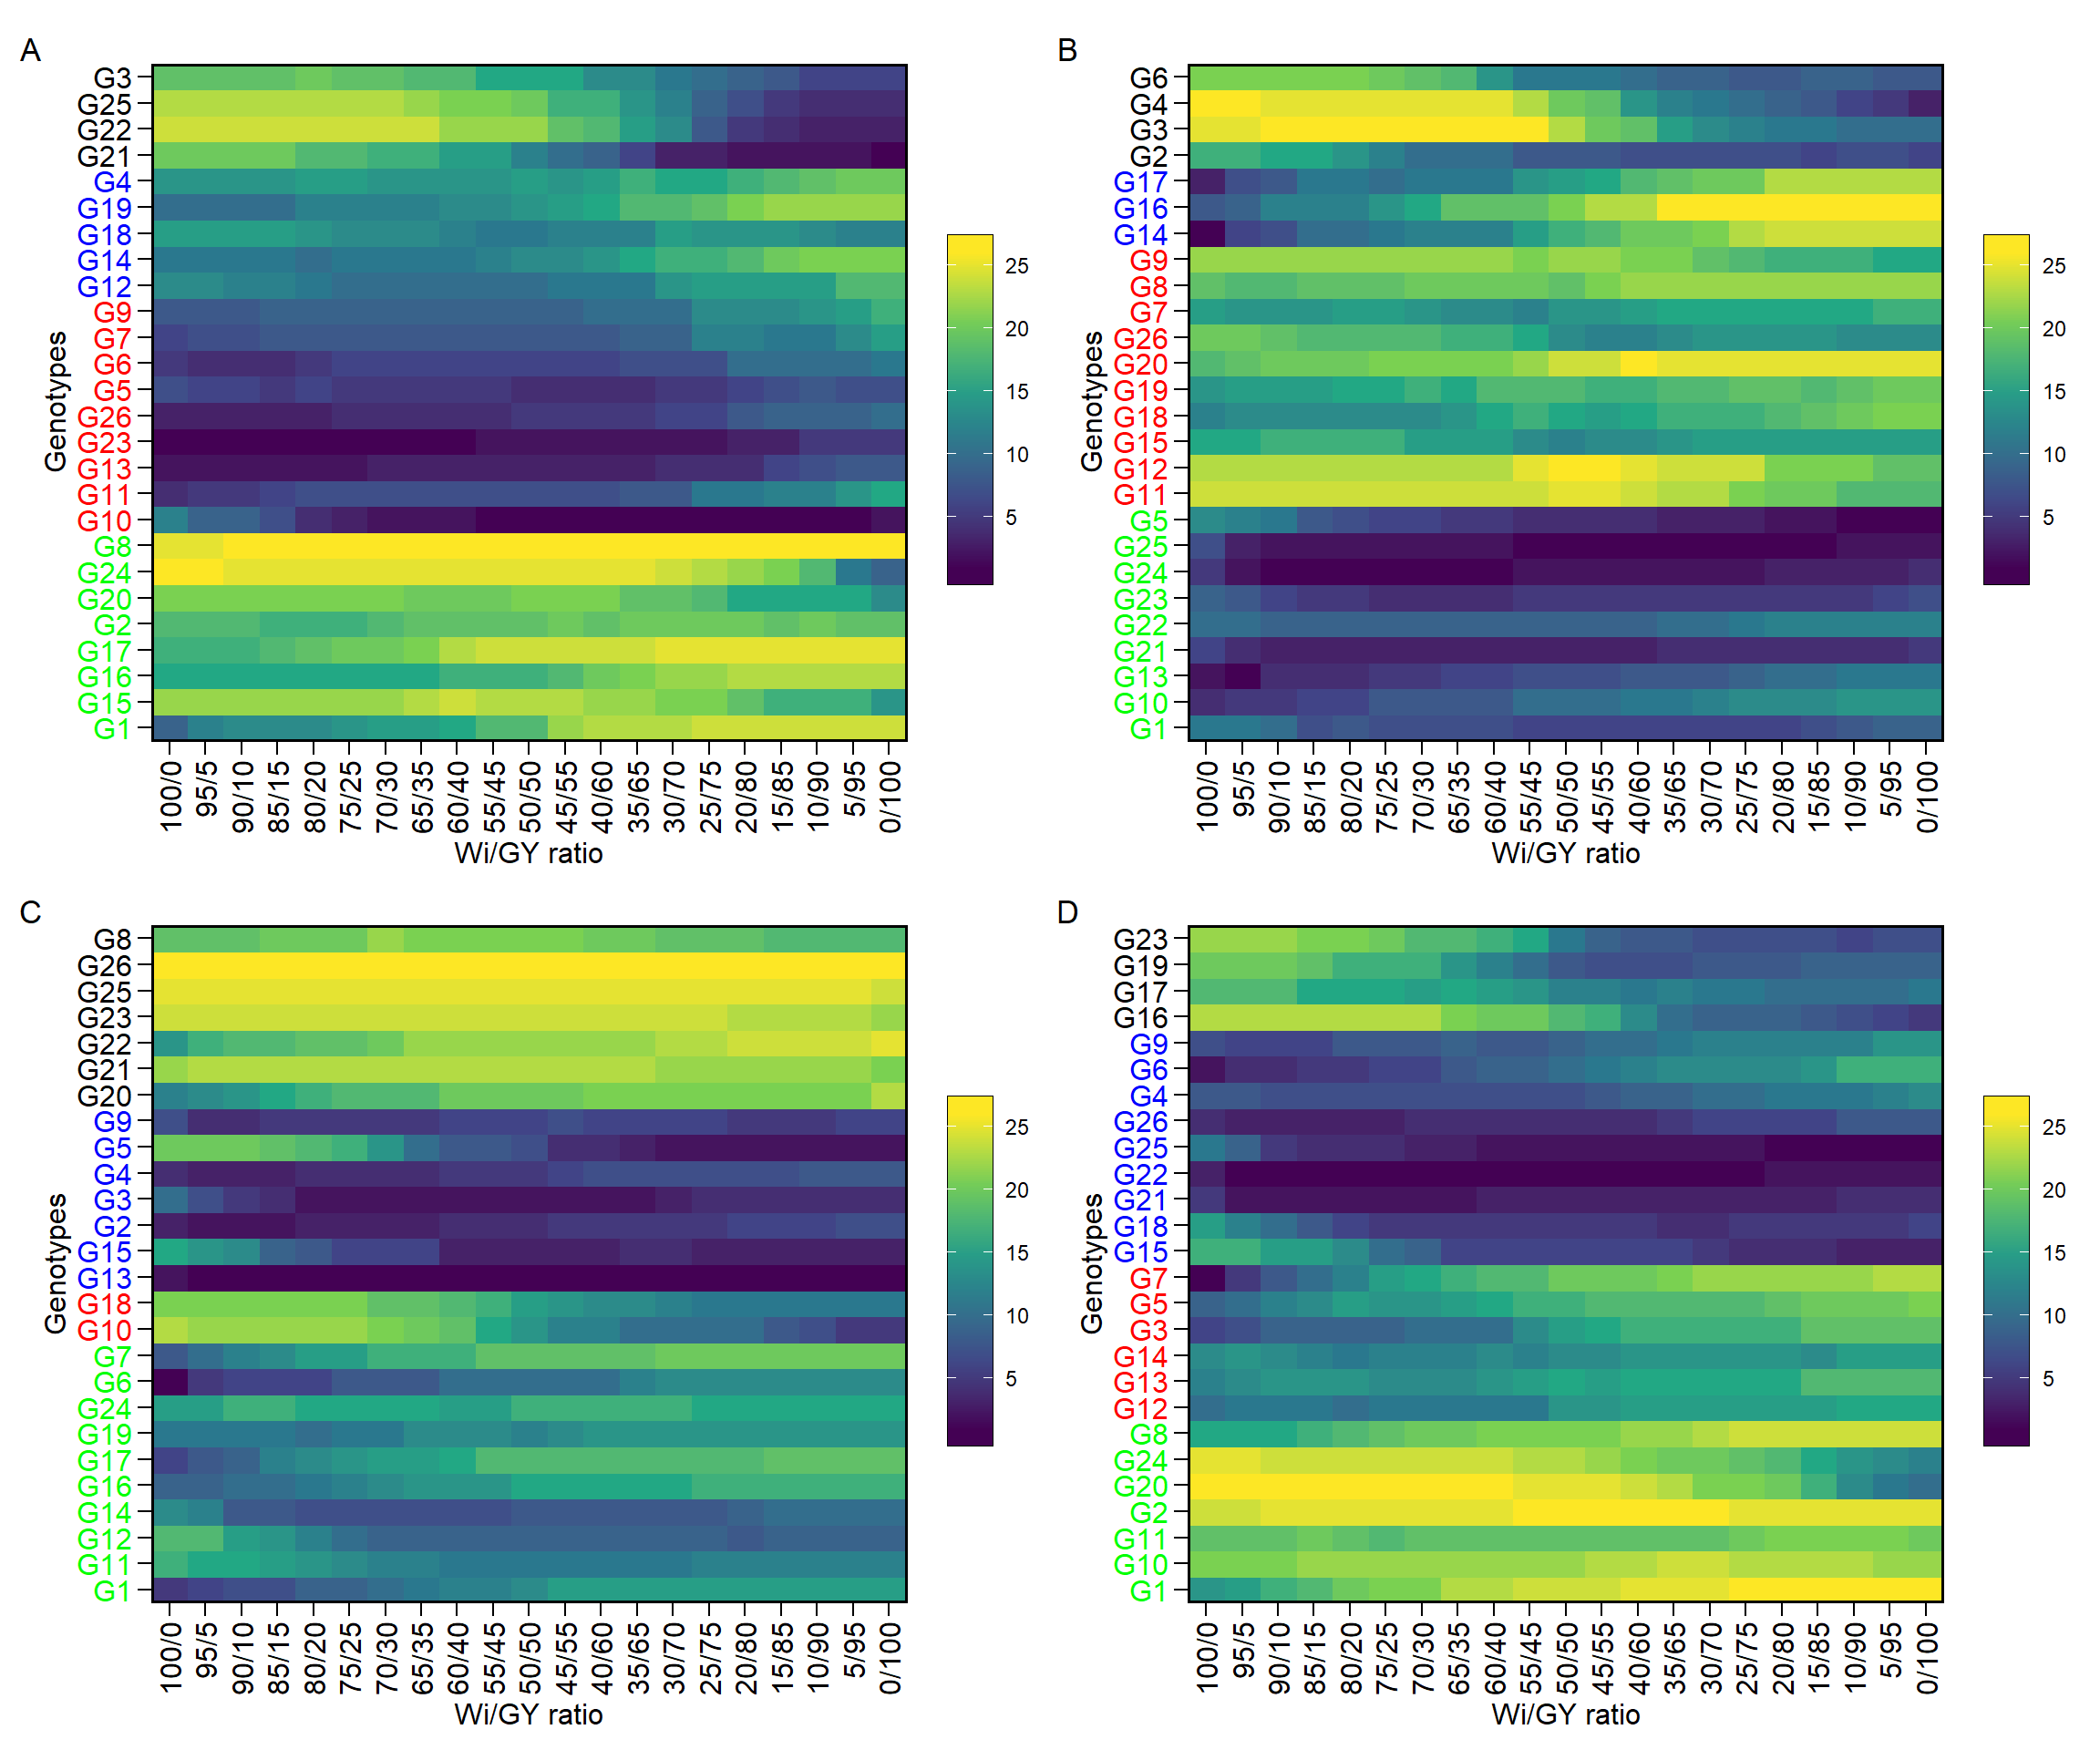
Figure 17: Ranks of 26 maize hybrids considering different weights for stability computed as the Wricke’s Ecovalence (Wi) and grain yielding (GY). The most-left ranks were obtained considering the stability only. The most right-ranks were obtained considering the grain yield only. Between the extremes, the ranks were obtained different weights for stability and yielding.