Computes the sum of squared distances between the original data and
reconstructed outline. It allows examining reconstructed outlines with the
addition of successive contributing harmonics indicated in the argument
nharm.
Usage
efourier_error(
  x,
  nharm = NULL,
  type = c("error", "outline", "deviations"),
  plot = TRUE,
  ncol = NULL,
  nrow = NULL
)
Arguments
- x
An object computed with
efourier().- nharm
An integer or vector of integers indicating the number of harmonics to use. If not specified the number of harmonics used in
xis used.- type
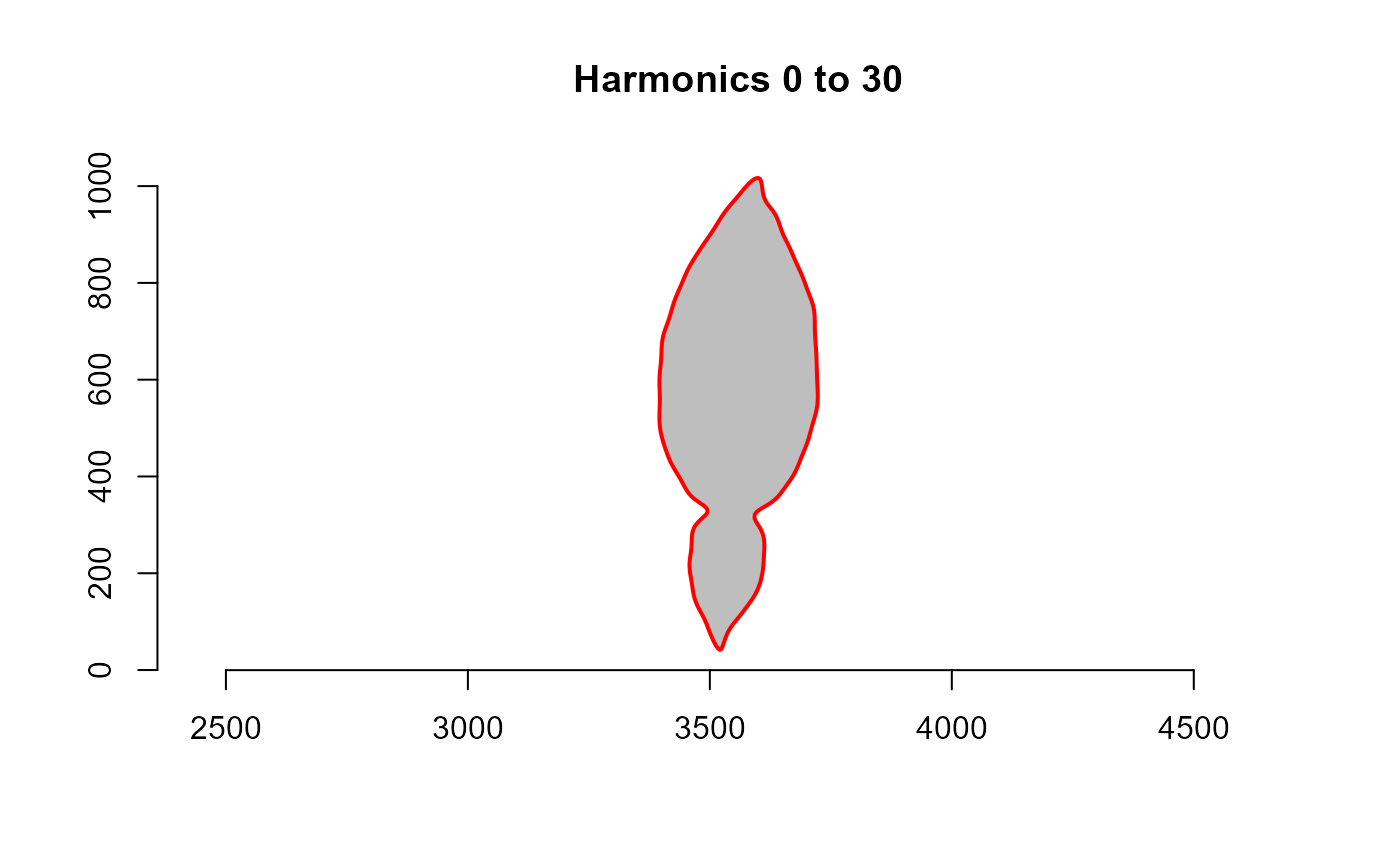
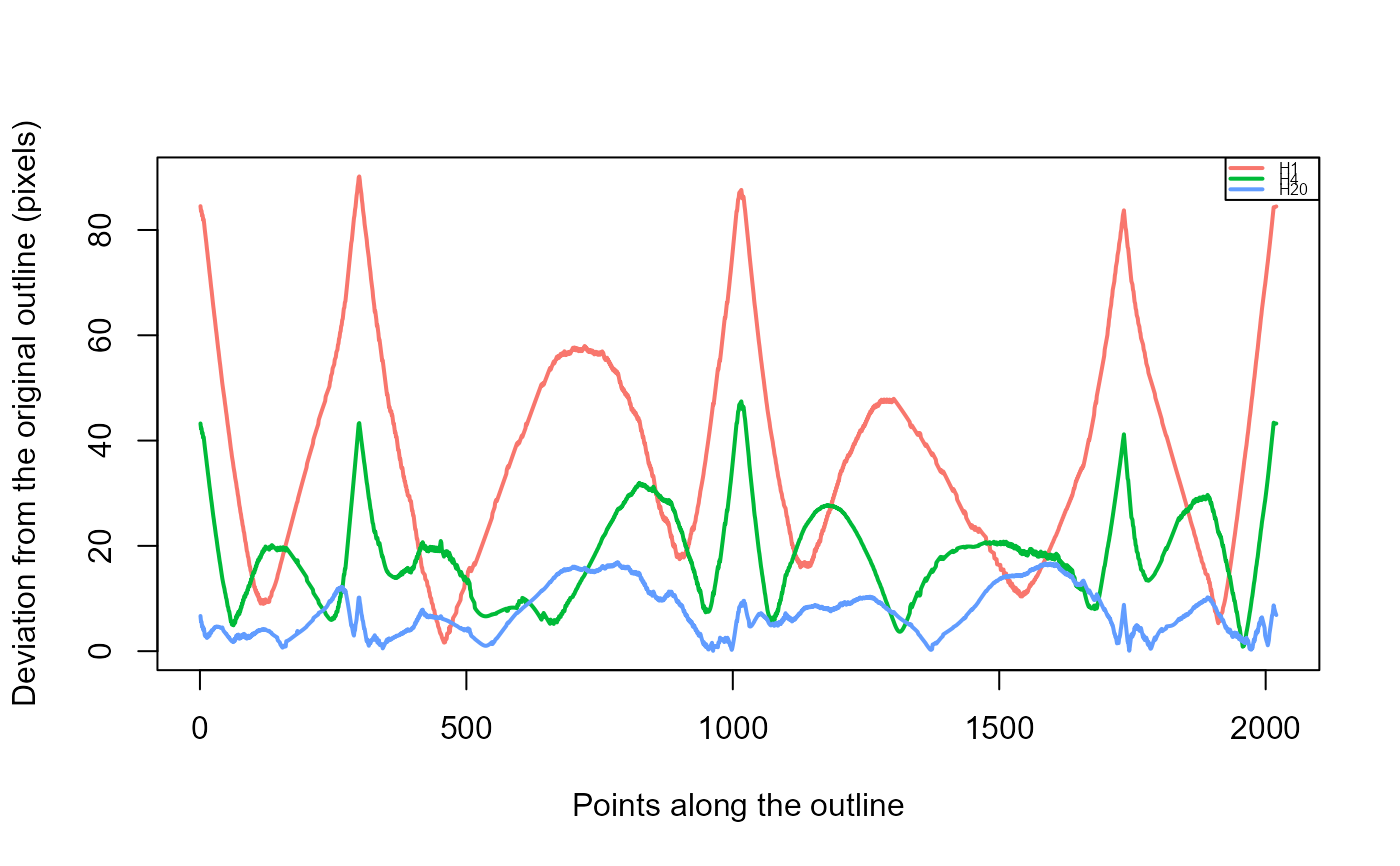
The type of plot to produce. By default, a line plot with the sum of squared distances (y-axis) and the number of harmonics (x-axis) is produced. If
type = "outline"is used, a plot with the original polygon and the constructed outline is produced. Iftype = "deviations"is used, a plot with the deviations from the original outline and reconstructed outline (y-axis) and points along the outline (x-axis) is produced.- plot
A logical to inform if a plot should be produced. Defaults to
TRUE.- ncol, nrow
The number of rows or columns in the plot grid. Defaults to
NULL, i.e., a square grid is produced.
Value
A list with the objects:
dev_pointsA list with the deviations (distances) from original and predicted outline for each pixel of the outline.data.frameobject with the minimum, maximum and average deviations (based on the outline points).
If x is an object of class efourier_lst, a list will be returned.