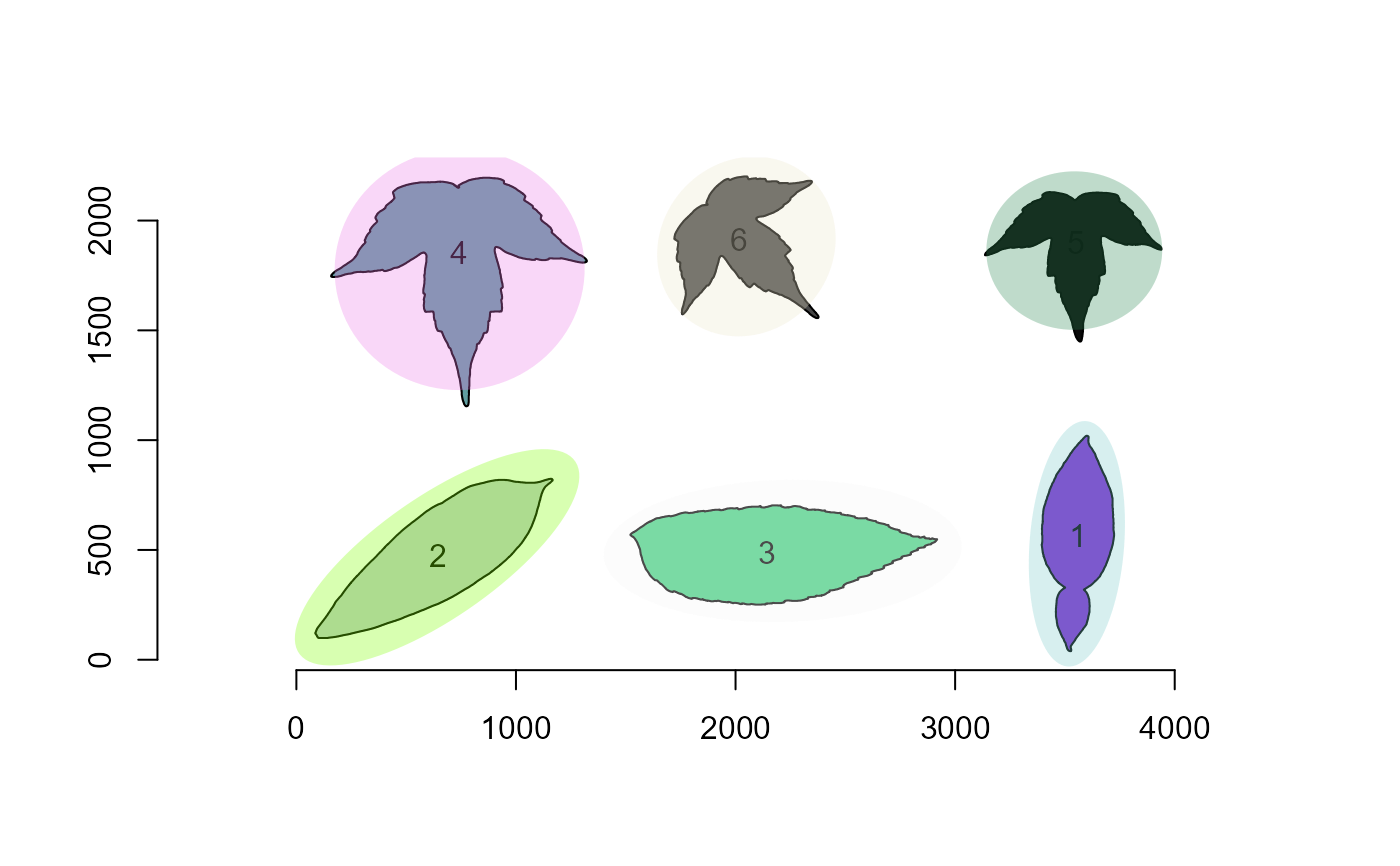
Produces a confidence ellipse that is an iso-contour of the Gaussian distribution, allowing to visualize a 2D confidence interval.
Usage
ellipse(
  x,
  conf = 0.95,
  np = 100,
  plot = TRUE,
  fill = "green",
  alpha = 0.3,
  random_fill = TRUE
)
Arguments
- x
A
matrix, adata.frameor alistof perimeter coordinates, often produced withobject_contour().- conf
The confidence level. Defaults to
0.95- np
Number of sampled points on the ellipse.
- plot
Create a plot? Defaults to
TRUE.- fill
The color to fill the ellipse. Defaults to
"green".- alpha
The alpha value to define the opacity of ellipse. Defaults to
0.3- random_fill
Fill multiple ellipses with random colors? Defaults to
TRUE.