Creates a list of object coordinates given the desired number of nrow and
columns. It starts by selecting 4 points at the corners of objects of
interest in the plot space. Then, given nrow and ncol, a grid is drawn
and the objects' coordinates are returned.
Usage
image_shp(
  img,
  nrow = 1,
  ncol = 1,
  buffer_x = 0,
  buffer_y = 0,
  interactive = FALSE,
  viewer = get_pliman_viewer(),
  col_line = "red",
  size_line = 2,
  col_text = "red",
  size_text = 1,
  plot = TRUE
)
Arguments
- img
An object of class
Image- nrow
The number of desired rows in the grid. Defaults to
1.- ncol
The number of desired columns in the grid. Defaults to
1.- buffer_x, buffer_y
Buffering factor for the width and height, respectively, of each individual shape's side. A value between 0 and 0.5 where 0 means no buffering and 0.5 means complete buffering (default: 0). A value of 0.25 will buffer the shape by 25% on each side.
- interactive
If
FALSE(default) the grid is created automatically based on the image dimension and number of rows/columns. Ifinteractive = TRUE, users must draw points at the diagonal of the desired bounding box that will contain the grid.- viewer
The viewer option. If not provided, the value is retrieved using
get_pliman_viewer(). This option controls the type of viewer to use for interactive plotting. The available options are"base"and"mapview". If set to "base", the base R graphics system is used for interactive plotting. If set to "mapview", the mapview package is used. To set this argument globally for all functions in the package, you can use theset_pliman_viewer()function. For example, you can runset_pliman_viewer("mapview")to set the viewer option to "mapview" for all functions.- col_line, col_text
The color of the line/text in the grid. Defaults to
"red".- size_line, size_text
The size of the line/text in the grid. Defaults to
2.5.- plot
Plots the grid on the image? Defaults to
TRUE.
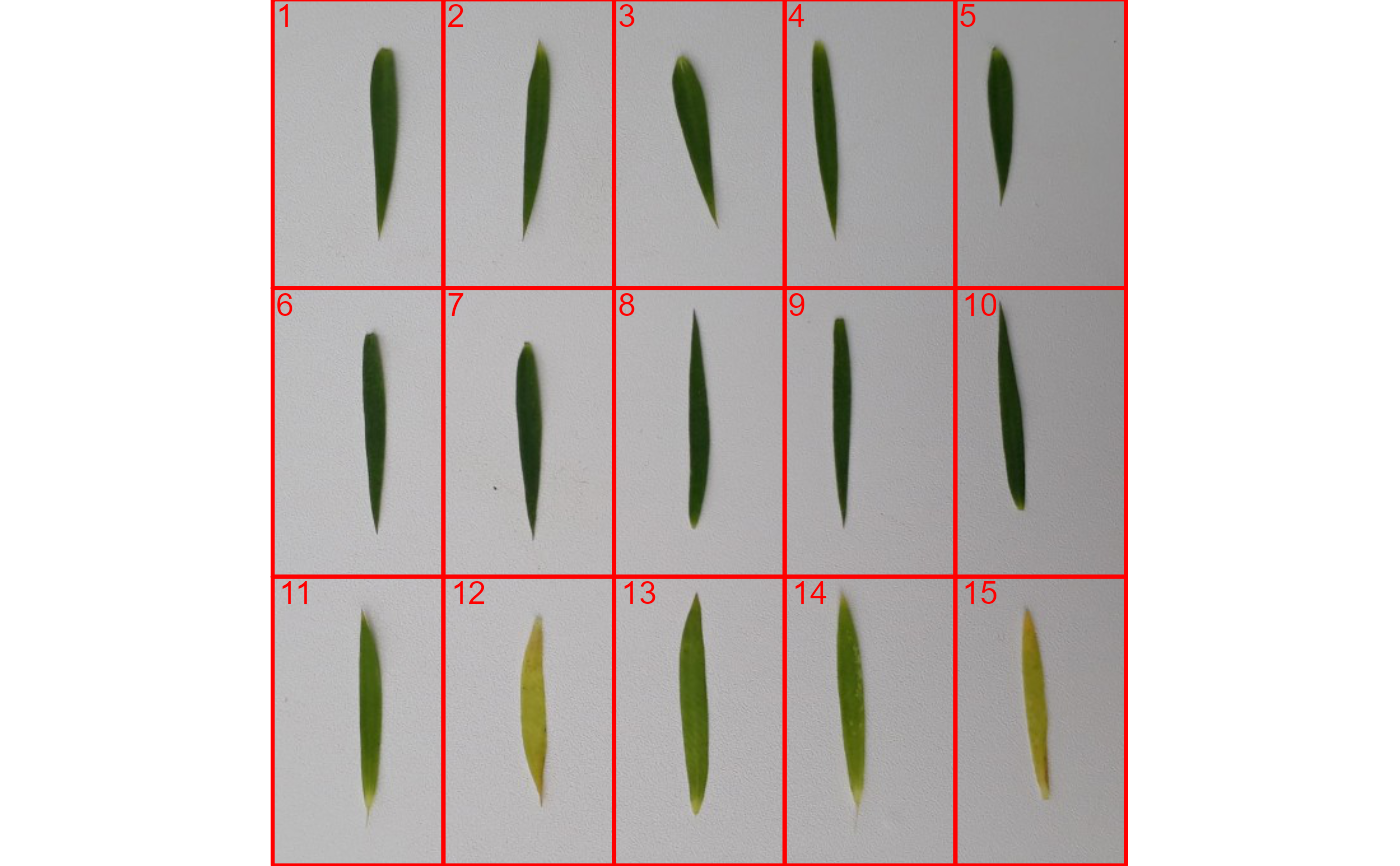
Examples
library(pliman)
flax <- image_pliman("flax_leaves.jpg")
shape <- image_shp(flax, nrow = 3, ncol = 5)