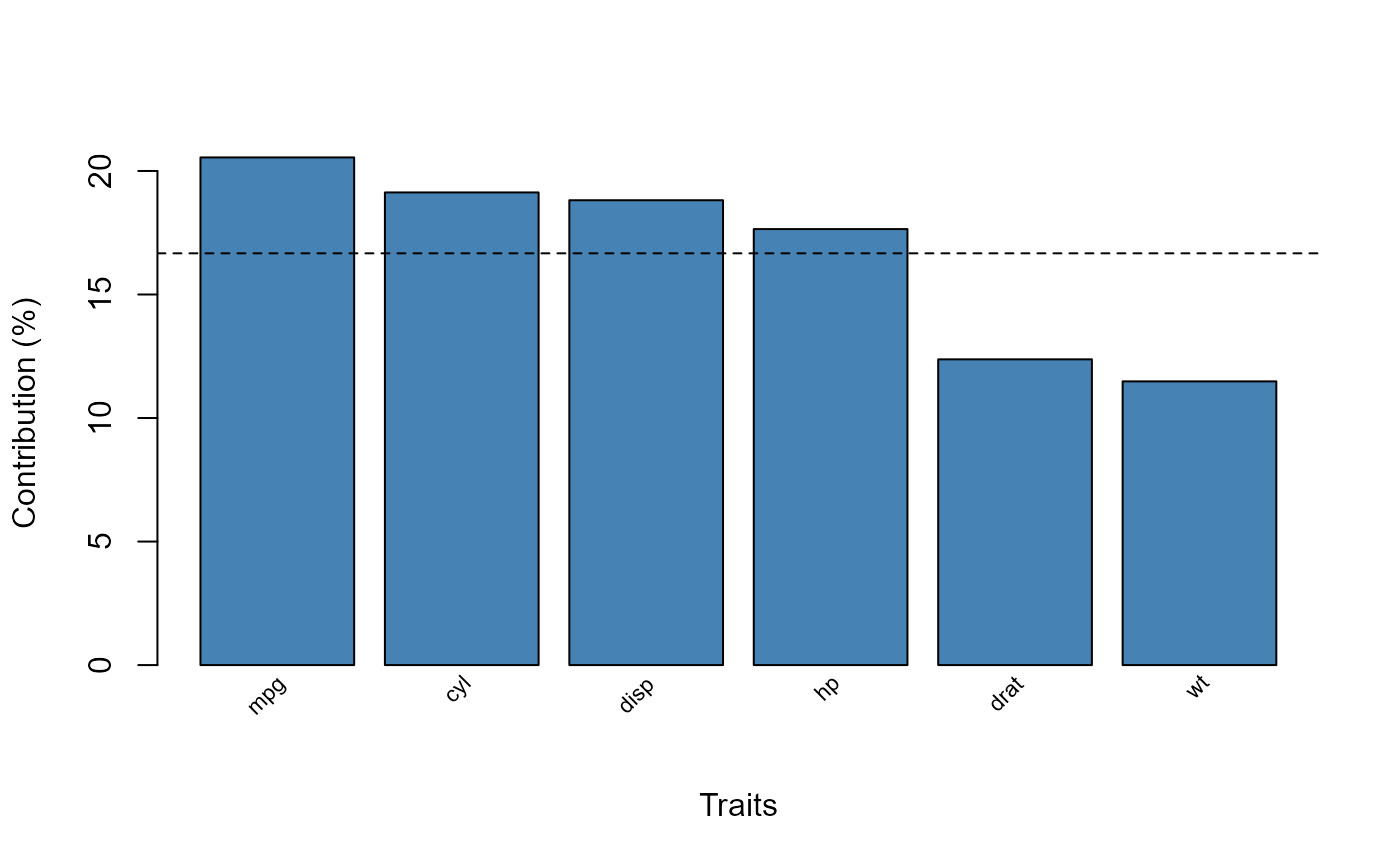
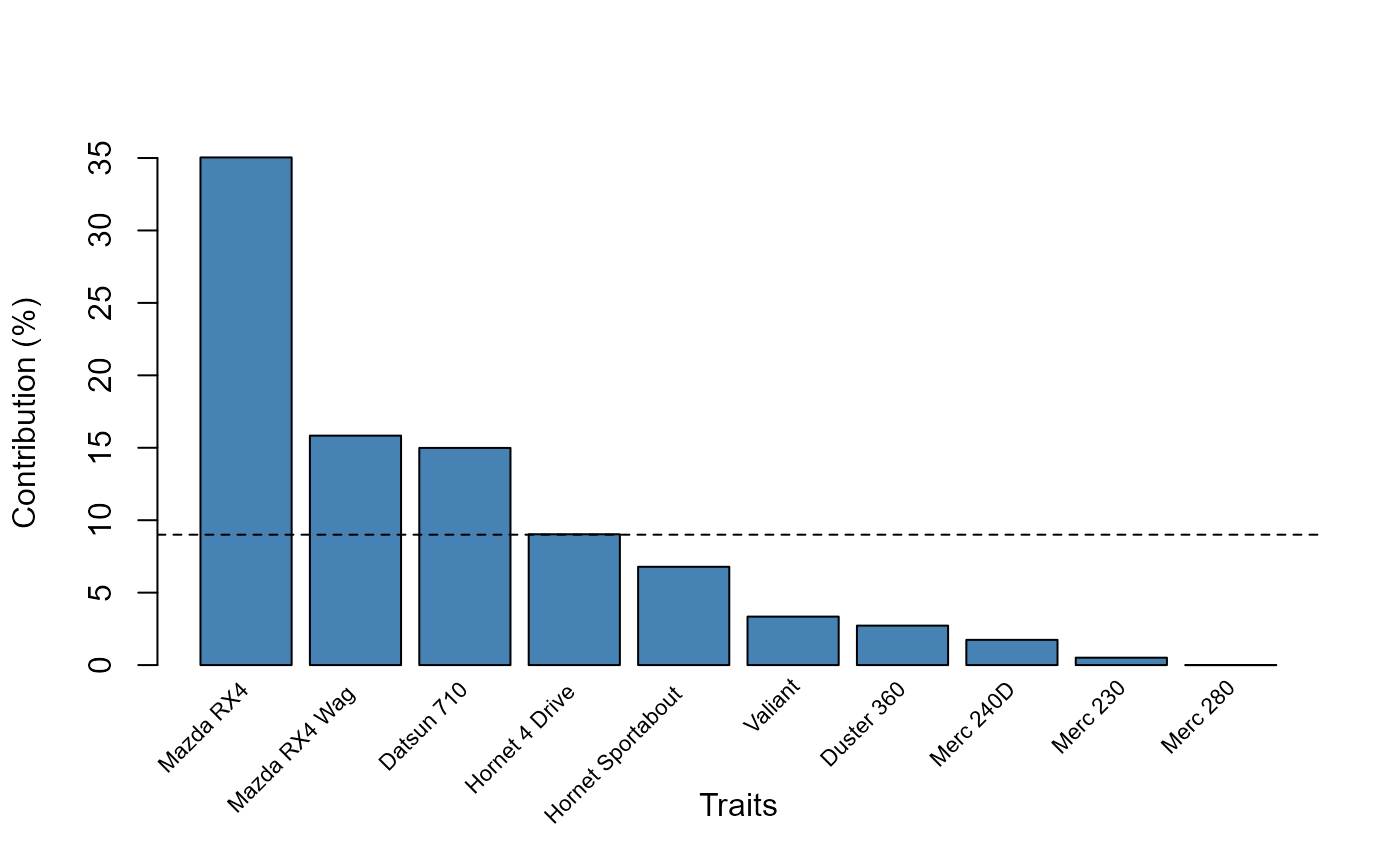
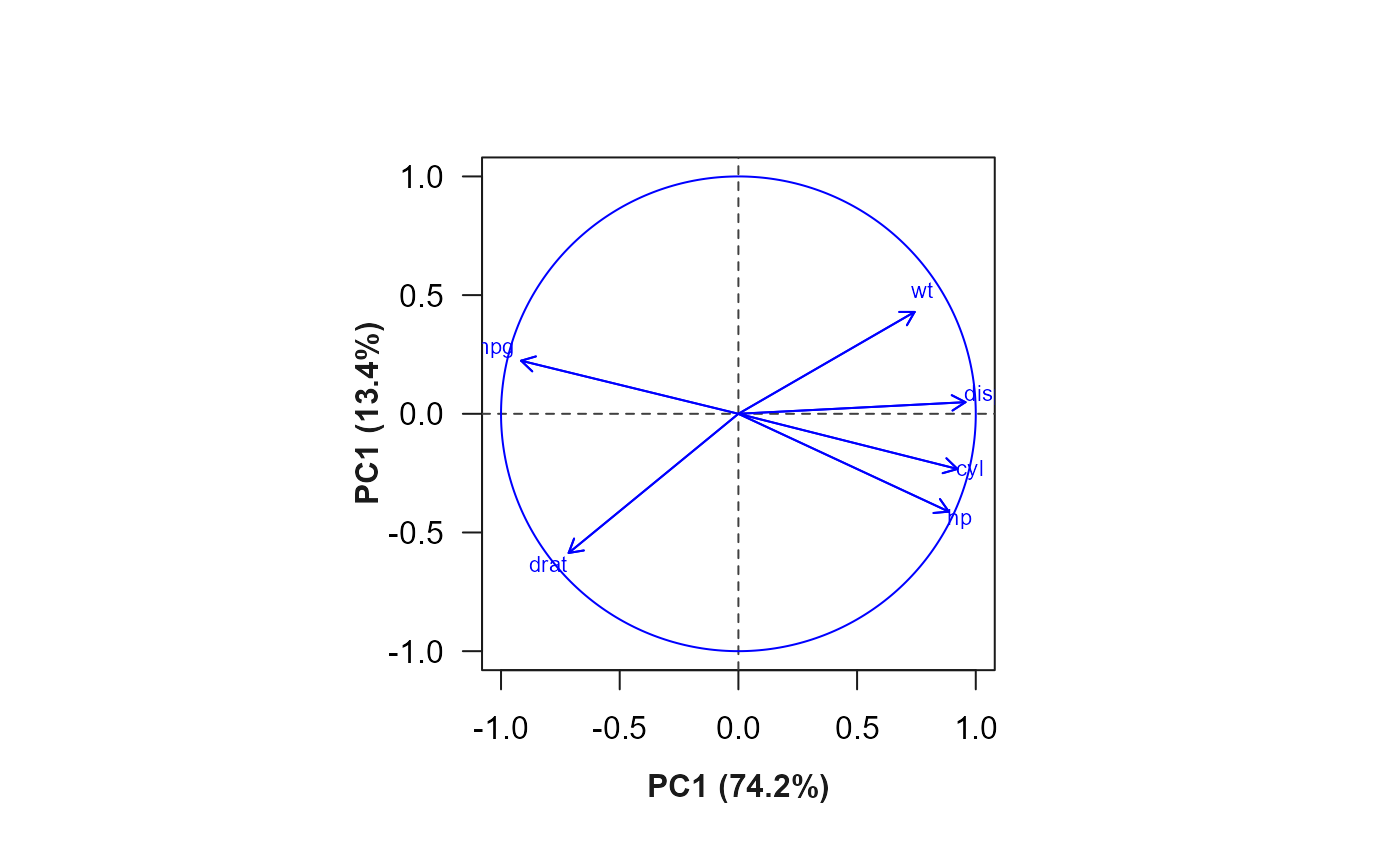
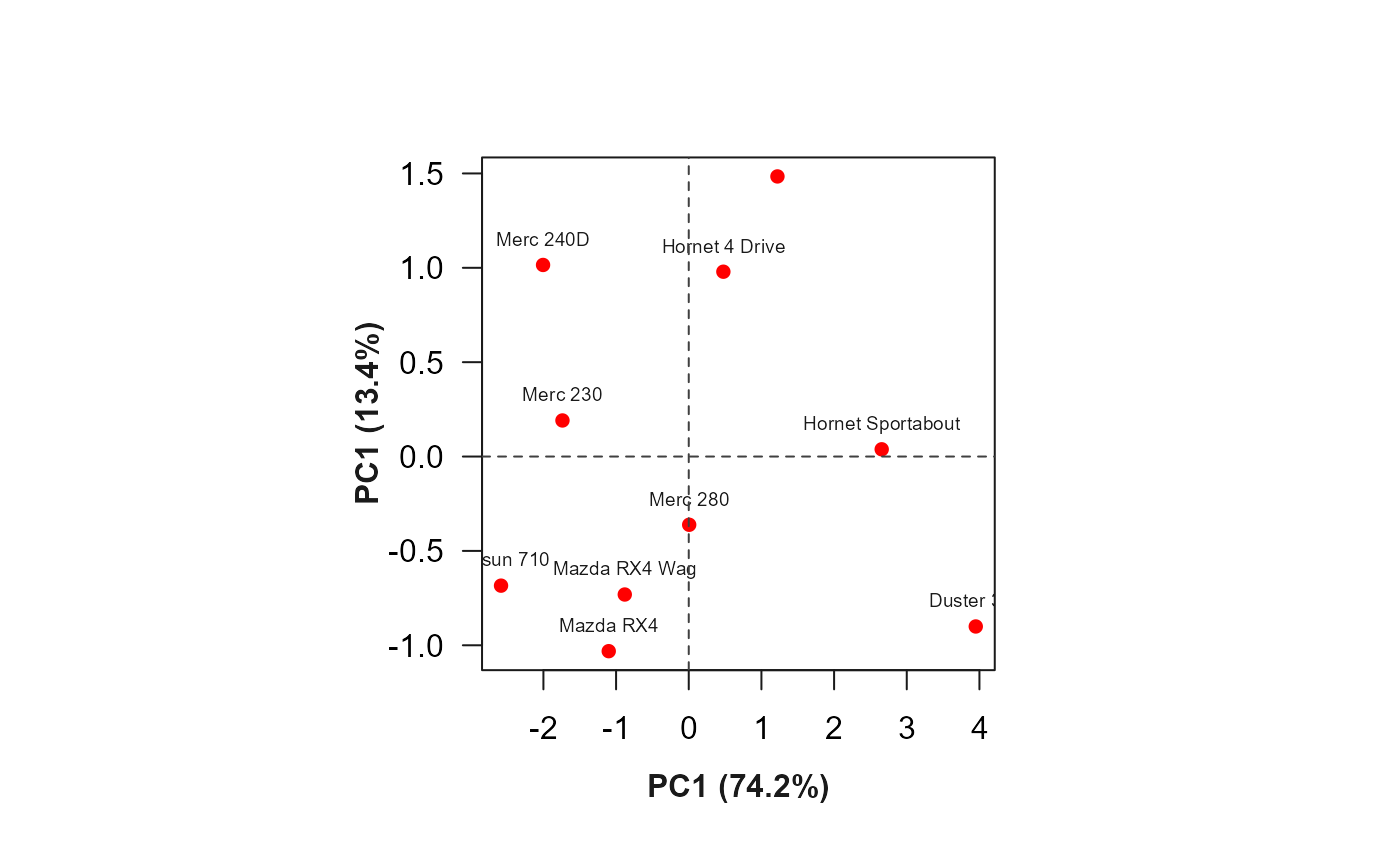
pca()Computes a Principal Component Analysis. It wrappersstats::prcomp(), but returns more results such as data, scores, contributions and quality of measurements for individuals and variables.get_biplot(): Produces a biplot for an object computed withpca().plot.pca(): Produces several types of plots, depending on thetypeandwhicharguments.type = "var"Produces a barplot with the contribution (which = "contrib"), qualitity of adjustmentwhich = "cos2", and a scatter plot with coordinates (which = "coord") for the variables.type = "ind"Produces a barplot with the contribution (which = "contrib"), qualitity of adjustmentwhich = "cos2", and a scatter plot with coordinates (which = "coord") for the individuals.type = "biplot"Produces a biplot.
Arguments
- x
For
pca(), a numeric or complex matrix (or data frame) which provides the data for the principal components analysis.For
plot.pca()andget_biplot(), an object computed withpca().
- scale
A logical value indicating whether the variables should be scaled to have unit variance before the analysis takes place. Defaults to
TRUE.- axes
The principal component axes to plot. Defaults to
axes = c(1, 2), i.e., the first and second interaction principal component axis.- show
Which to show in the biplot. Defaults to
"both"(both variables and individuals). One can also use"var", or"ind".- show_ind_id
Shows the labels for individuals? Defaults to
TRUE.- show_unit_circle
Shows the unit variance circle? Defaults to
TRUE.- expand
An expansion factor to apply when plotting the second set of points relative to the first. This can be used to tweak the scaling of the two sets to a physically comparable scale. Setting to
TRUEwill automatically compute the expansion factor. Alternatively, a numeric value can be informed.- type
One of
"var"(to plot variables),"ind"(to plot individuals), or"biplot"to create a biplot.- which
Which measure to plot. Either
which = "contribution"(default),which = "cos2"(quality of representation), orwhich = "coord"(coordinates)- axis
The axist to plot the contribution/cos2. Defaults to 1.
- ...
Further arguments passed on to
get_biplot()whentype = "biplot". Otherwise, Whenwhich = "coord", further arguments passed on toget_biplot(). Whenwhich = "contrib", orwhich = "cos2"further arguments passed on tographics::barplot().
Value
pca()returns a list including:data: The raw data used to compute the PCA.variances: Variances (eigenvalues), and proportion of explained variance for each component.center,scale: the centering and scaling used.ind,varA list with the following objects for individuals/variables, respectively.coord: coordinates for the individuals/variables (loadings * the component standard deviations)cos2: cos2 for the individuals/variables (coord^2)contrib: The contribution (in percentage) of a variable to a given principal component: (cos2 * 100) / (total cos2 of the component)
plot.pca()returns a list with the coordinates used.get_biplot()returns aNULLobject