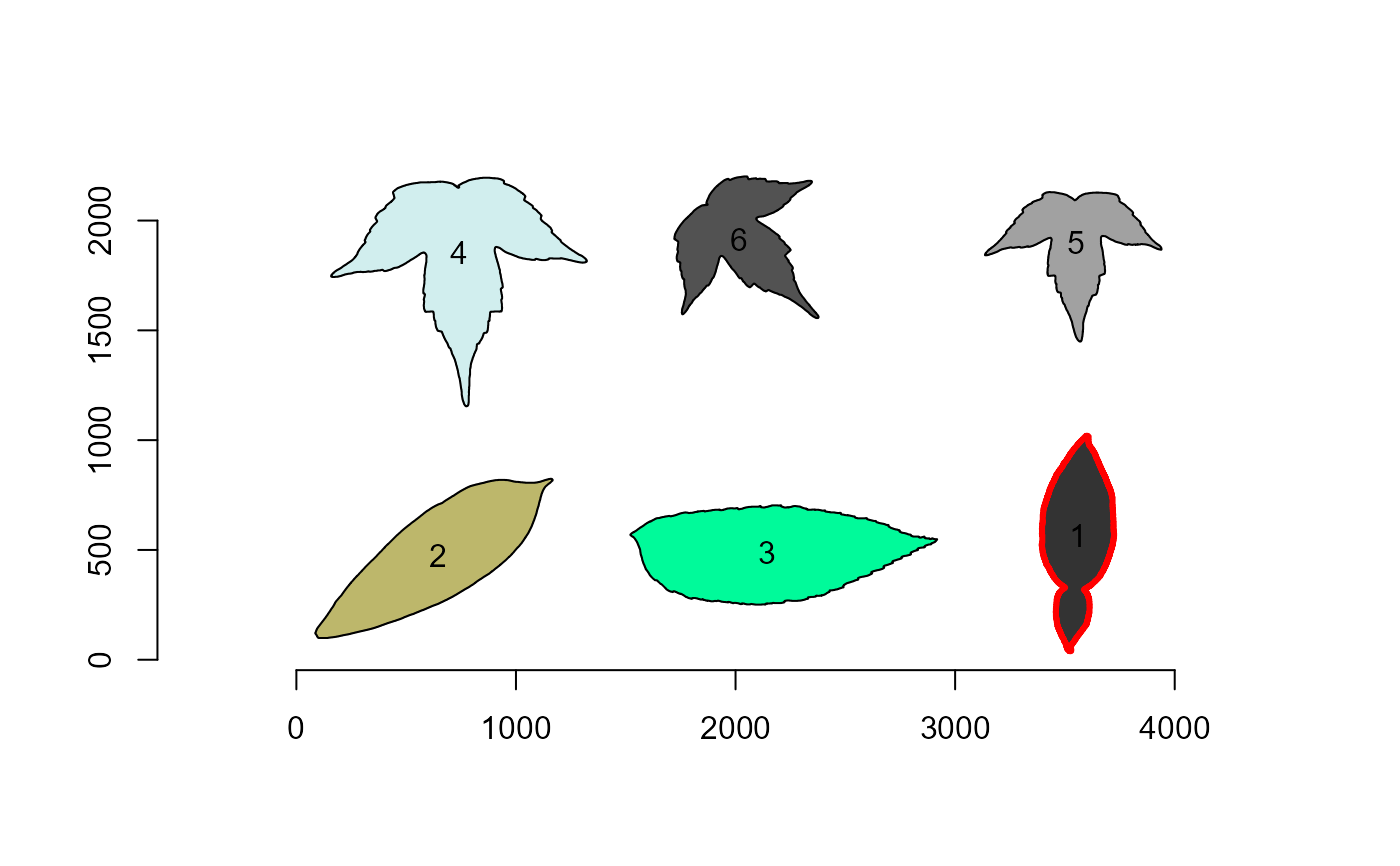
plot_contour()Plot contour lines.plot_polygon()Plots a polygon describing the objects.plot_mass()Plots the center of mass along with maximum and minimum radius.plot_ellipse()Plots an ellipse that fits the major and minor axis for each object.
Usage
plot_contour(x, id = NULL, col = "black", lwd = 1, ...)

plot_polygon(
  x,
  fill = "gray",
  random_fill = TRUE,
  points = FALSE,
  merge = TRUE,
  border = "black",
  alpha = 1,
  add = FALSE,
  nrow = NULL,
  ncol = NULL,
  aspect_ratio = 1,
  show_id = TRUE,
  xlim = NULL,
  ylim = NULL,
  ...
)

plot_mass(x, id = NULL, col = "black", cex = 1, lwd = 1)

plot_ellipse(object, id = NULL, col = "black", lwd = 1)
Arguments
- x
A 2-column matrix with the
xandycoordinates.- id
The object identification (numeric) to plot the contour/ellipse. By default (
id = NULL), the contour is plotted to all objects.- col, lwd, cex
The color, width of the lines, and size of point, respectively.
- ...
For
plot_contour()andplot_ellipse()further arguments passed on tographics::lines().For
plot_mass(), further arguments passed on tographics::points().For
plot_polygon(), further arguments passed on tographics::polygon().
- fill, border, alpha
The color to fill the polygon, the color of the polygon's border, and the alpha transparency (1 opaque, 0 transparent).
- random_fill
Fill multiple objects with random colors? Defaults to
TRUE.- points
Plot the points? Defaults to
FALSE.- merge
Merge multiple objects into a single plot? Defaults to
TRUE. IfFALSE, a single callplot()will be used for each objects. Usenrowandncolto control the number of rows and columns of the window.- add
Add the current plot to a previous one? Defaults to
FALSE.- nrow, ncol
The number of rows and columns to use in the composite image. Defaults to
NULL, i.e., a square grid is produced.- aspect_ratio
The x/y aspect ratio. Defaults to
1. This will set up the window so that one data unit in the y direction is equal to one data unit in the x direction. Setaspect_ratio = NULLto fit the object to the window size.- show_id
Shows the object id? Defaults to
TRUE.- xlim, ylim
A numeric vector of length 2 (min; max) indicating the range of
xandy-axes.- object
An object computed with
analyze_objects().