![[Experimental]](figures/lifecycle-experimental.svg)
This is a wraper function around patchwork::wrap_plots() and
patchwork::plot_annotation() to arrange ggplot2 objects.
Usage
arrange_ggplot(
  ...,
  nrow = NULL,
  ncol = NULL,
  widths = NULL,
  heights = NULL,
  guides = NULL,
  design = NULL,
  legend.position = "bottom",
  title = NULL,
  subtitle = NULL,
  caption = NULL,
  tag_levels = NULL,
  tag_prefix = NULL,
  tag_suffix = NULL,
  tag_sep = NULL,
  theme = NULL
)
Arguments
- ...
multiple
ggplots or a list containingggplotobjects.- nrow, ncol
The number of rows and columns, respectively.
- widths, heights
The relative widths and heights of each column and row in the grid. Will get repeated to match the dimensions of the grid.
- guides
A string specifying how guides should be treated in the layout. Defaults to
'auto'. Other possible values are'keep'and'collect'. In this case, will collect guides below to the given nesting level, removing duplicates.- design
Specification of the location of areas in the layout.
- legend.position
The position of the legends in the plot if
guides = "collect"Default to'bottom'.- title, subtitle, caption
Text strings to use for the various plot annotations.
- tag_levels
A character vector defining the enumeration format to use at each level. Possible values are
'a'for lowercase letters,'A'for uppercase letters,'1'for numbers,'i'for lowercase Roman numerals, and'I'for uppercase Roman numerals. It can also be a list containing character vectors defining arbitrary tag sequences. If any element in the list is a scalar and one of'a','A','1','i', or'I', this level will be expanded to the expected sequence.- tag_prefix, tag_suffix
Strings that should appear before or after the tag.
- tag_sep
A separator between different tag levels.
- theme
A ggplot theme specification to use for the plot. Only elements related to the titles as well as plot margin and background is used.
Examples
# \donttest{
library(ggplot2)
library(metan)
p1 <- ggplot(mtcars, aes(wt, mpg)) +
geom_point()
p2 <- ggplot(mpg, aes(class, hwy)) +
geom_boxplot()
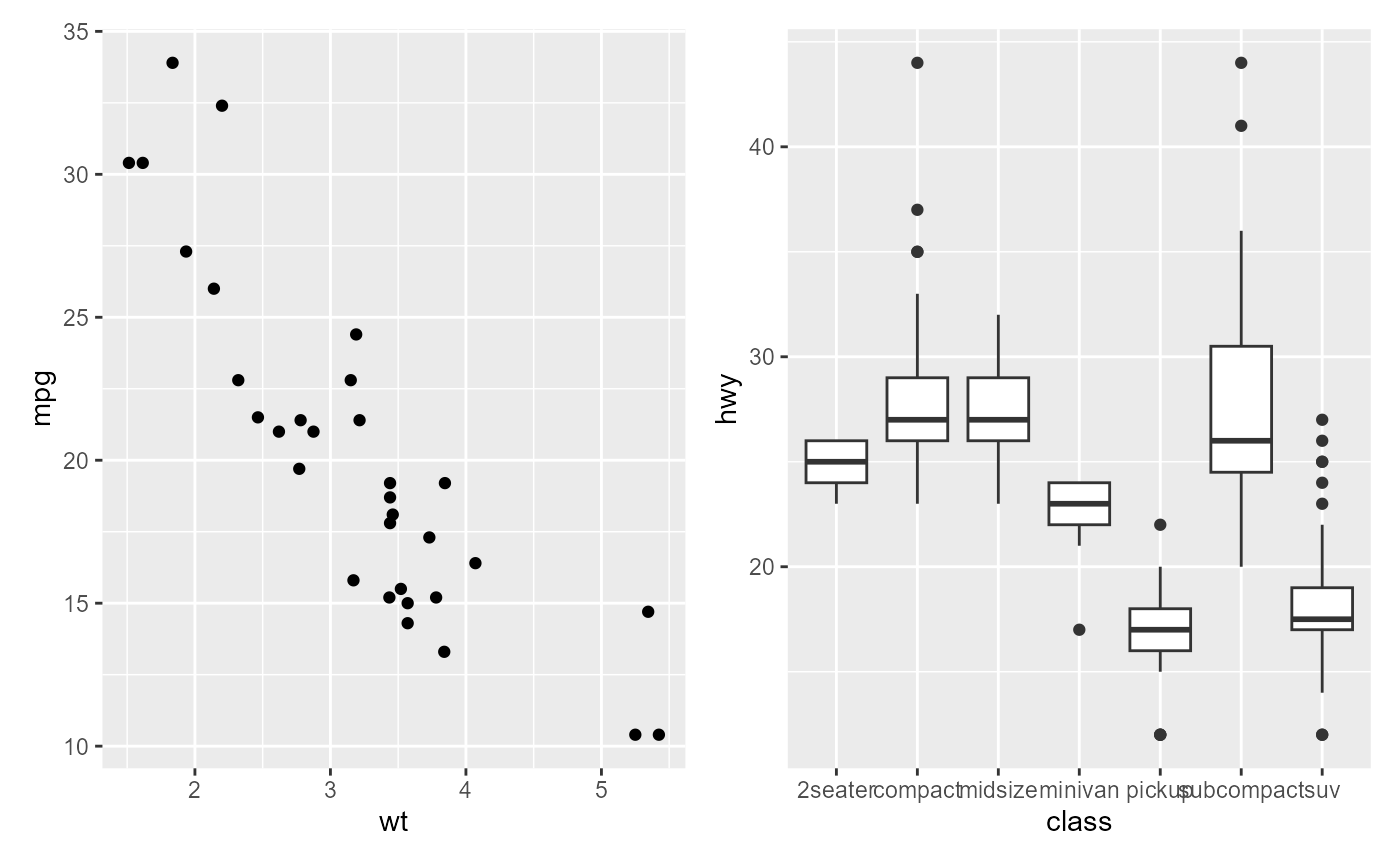
# Default plot
arrange_ggplot(p1, p2)
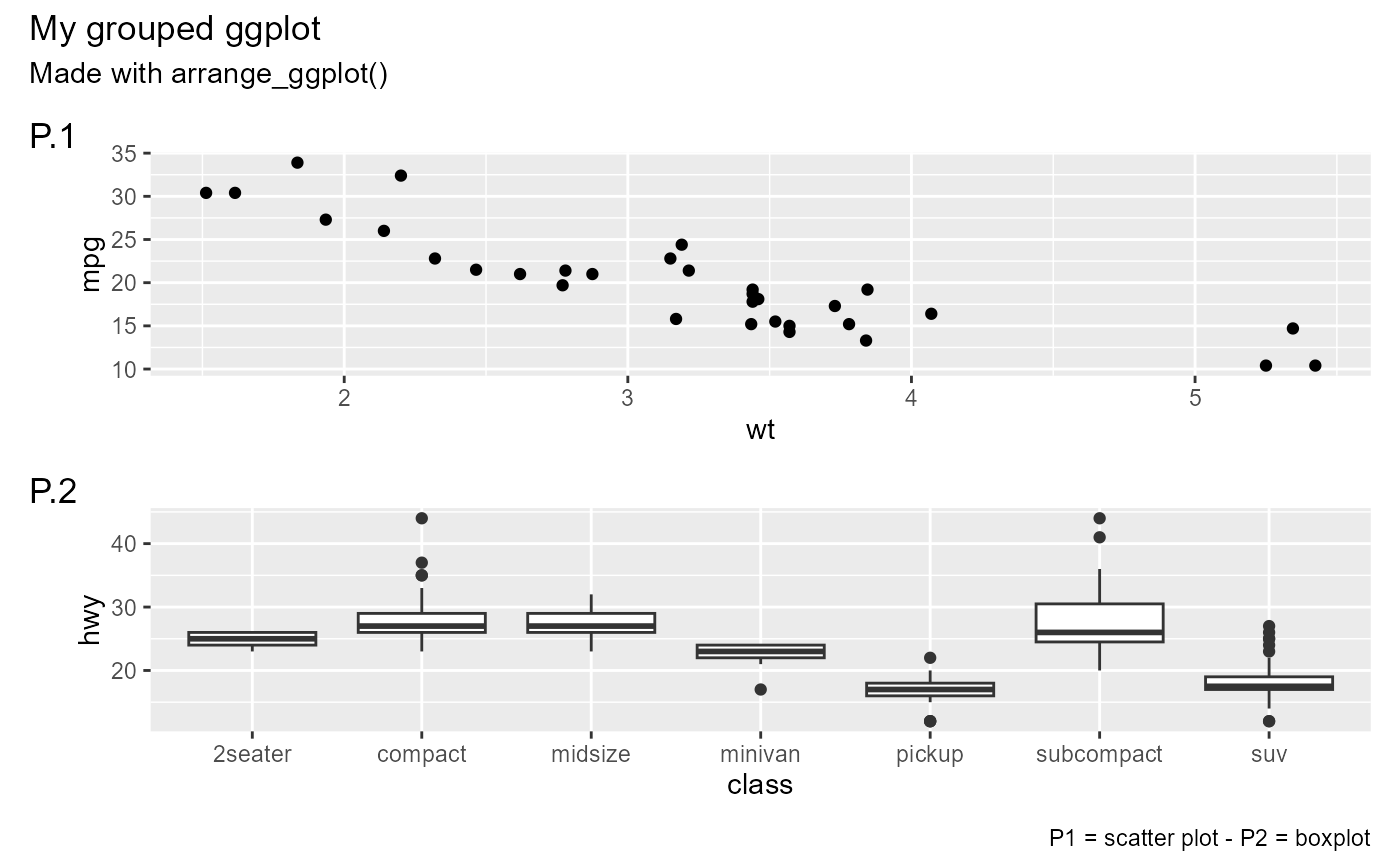
 # Insert plot annotation, titles and subtitles
arrange_ggplot(p1, p2,
ncol = 1,
tag_levels = "1",
tag_prefix = "P.",
title = "My grouped ggplot",
subtitle = "Made with arrange_ggplot()",
caption = "P1 = scatter plot - P2 = boxplot")
# Insert plot annotation, titles and subtitles
arrange_ggplot(p1, p2,
ncol = 1,
tag_levels = "1",
tag_prefix = "P.",
title = "My grouped ggplot",
subtitle = "Made with arrange_ggplot()",
caption = "P1 = scatter plot - P2 = boxplot")
 # }
# }