Indexes for simultaneous selection
Tiago Olivoto
2023-03-06
Source:vignettes/vignettes_indexes.Rmd
vignettes_indexes.RmdGetting started
In this section we will use the data examples data_ge
and data_ge2 provided in the metan
package. For more information, please, see ?data_ge and
?data_ge2. Other data sets can be used provided that the
following columns are in the dataset: environment, genotype,
block/replicate and response variable(s). See the section Rendering engine to know how HTML tables were
generated.
Multi-trait stability index
The function mtsi() is used to compute the multi-trait
stability index (MTSI) proposed by Olivoto et al. (2019). The first argument is a model of
the class waasb or waas. It is possible to
compute the MTSI for both WAASB -stability only- and
WAASBY -simultaneous selection for mean performance and
stability.
Based on stability only
In the following example, the selection of stable genotypes will
consider five traits, namely, KW, NKE, PH, EH, and TKW. Note that the
output of the function waasb() is passed to the function
mtsi() by the forward-pipe operator %>%.
Finally, the MTSI index is plotted using the function
plot().
Based on mean performance and stability
The following code considers that higher values for KW, NKE, TKW are
better, and lower values for PH and EH are better. By using
wresp = 65, the simultaneous selection for mean performance
and stability will prioritize the mean performance (mean of the
variables) rather than their stability across environments.
MTSI_index2 <-
  data_ge2 %>%
  waasb(ENV, GEN, REP,
        resp = c(KW, NKE, PH, EH, TKW),
        mresp = c("h, h, l, l, h"),
        wresp = 65) %>% # Default is 50
  mtsi(SI = 20)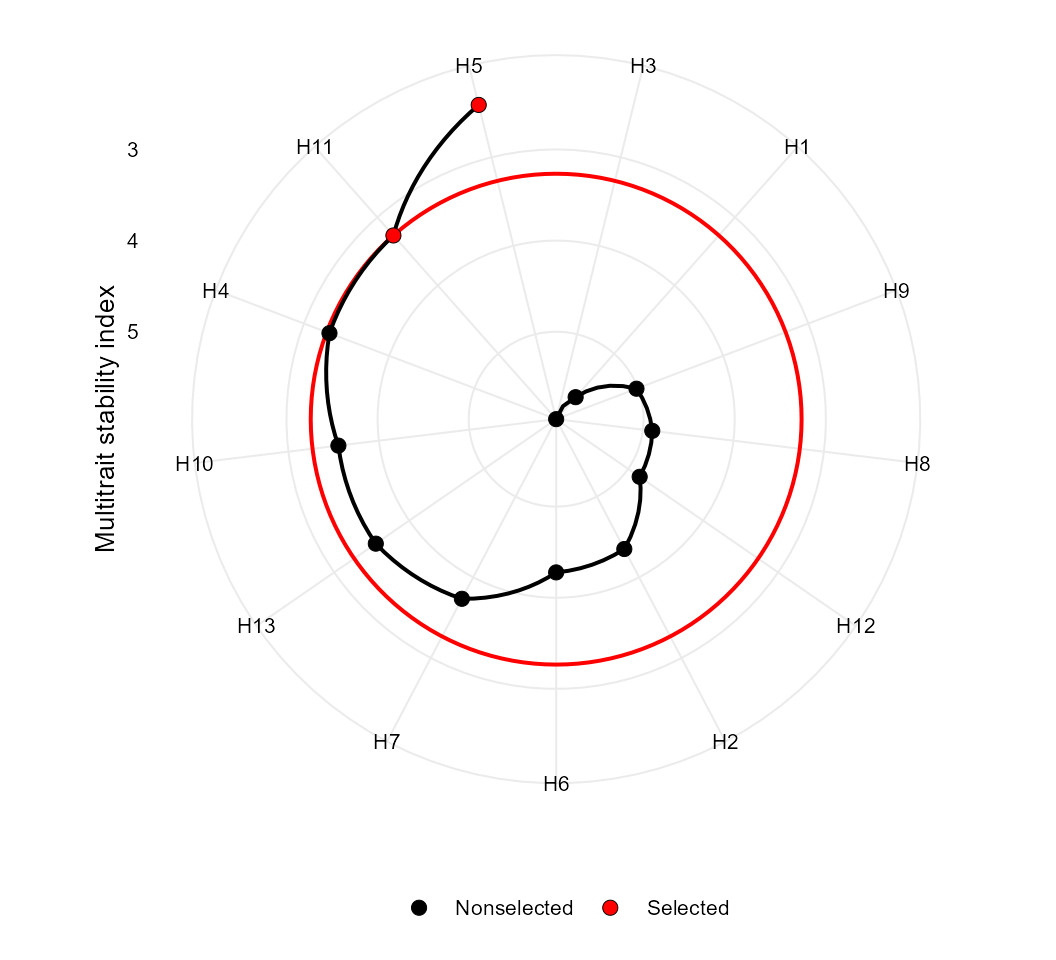
MGIDI index
The MGIDI index can be seen as the MTSI index with a weigth of 100
for mean performance. This index is computed with the function
mgidi(). Here, we will use the example data
data_g(). By default, all traits are assumed to be
increased. To change this default, use the argument
ideotype. For example, if for three traits, the first one
is assumed to be decreased and the last two are assumed to be increased,
use ideotype = c("l, h, h").
mod <- gamem(data_g,
             gen = GEN,
             rep = REP,
             resp = everything())
mgidi_index <- mgidi(mod,
                     SI = 20) # Selection intensity
p1 <- plot(mgidi_index, SI = 20)
p2 <- plot(mgidi_index, type = "contribution")
arrange_ggplot(p1, p2)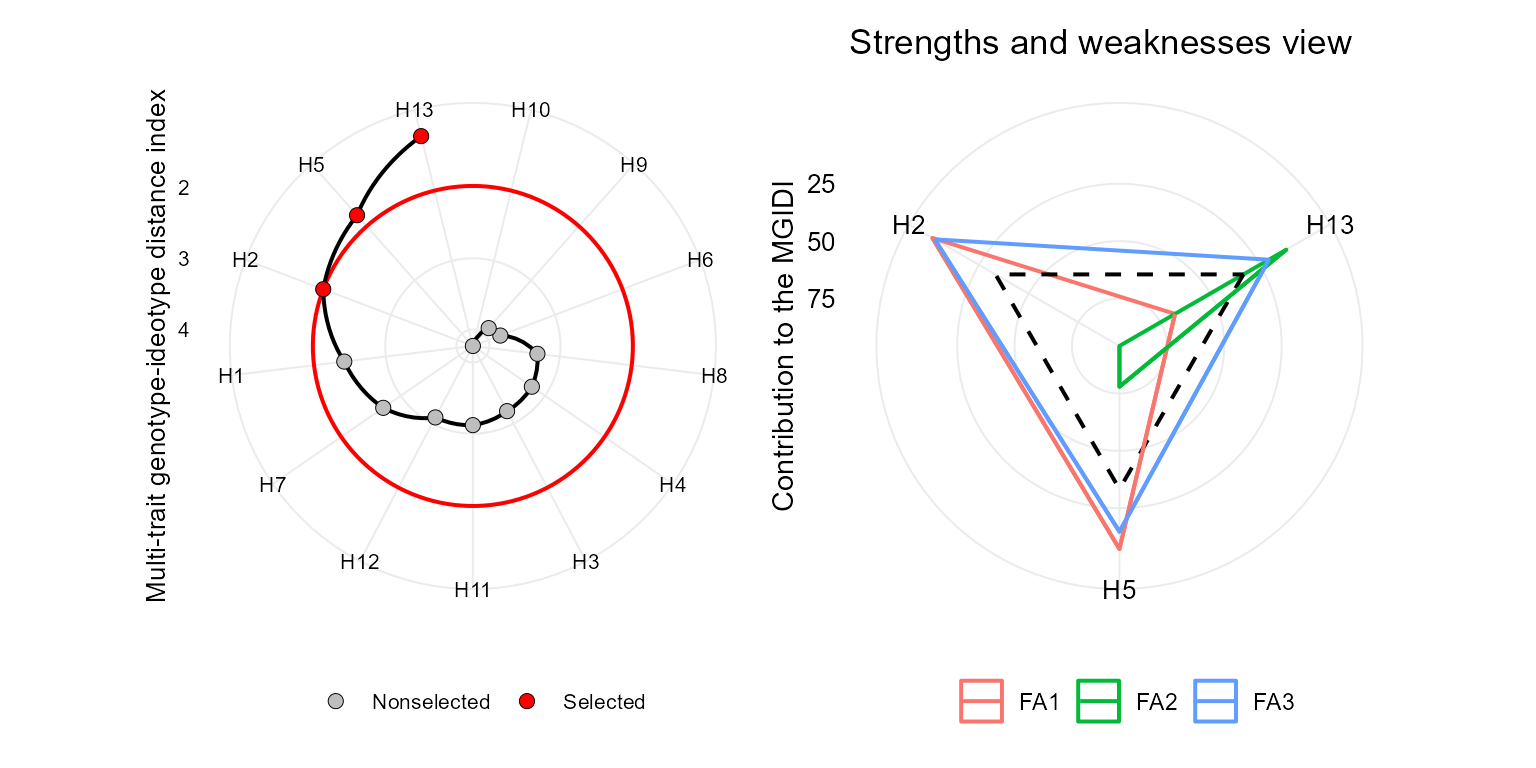
Smith-Hazel index
The Smith-Hazel index ((Smith 1936; Hazel 1943)) is
computed with the function Smith_Hazel(). Users can compute
the index either by declaring known genetic and phenotypic
variance-covariance matrices or by using as inpute data, a model fitted
with the function gamem(). In this case, the
variance-covariance are extracted internally. The economic weights in
the argument weights are set by default to 1 for all
traits.
smith <- Smith_Hazel(mod, SI = 20)FAI-BLUP index
The FAI-BLUP is a multi-trait index based on factor analysis and
ideotype-design recently proposed by Rocha,
Machado, and Carneiro (2018). It is based on factor analysis,
when the factorial scores of each ideotype are designed according to the
desirable and undesirable factors. Then, a spatial probability is
estimated based on genotype-ideotype distance, enabling genotype ranking
(Rocha, Machado, and Carneiro 2018). Here
we will use the mixed-model mod as inpute data. By default,
the selection is made to increase the value of all traits. Change this
default with the arguments DI and UI.
fai <- fai_blup(mod, SI = 20)
plot(fai)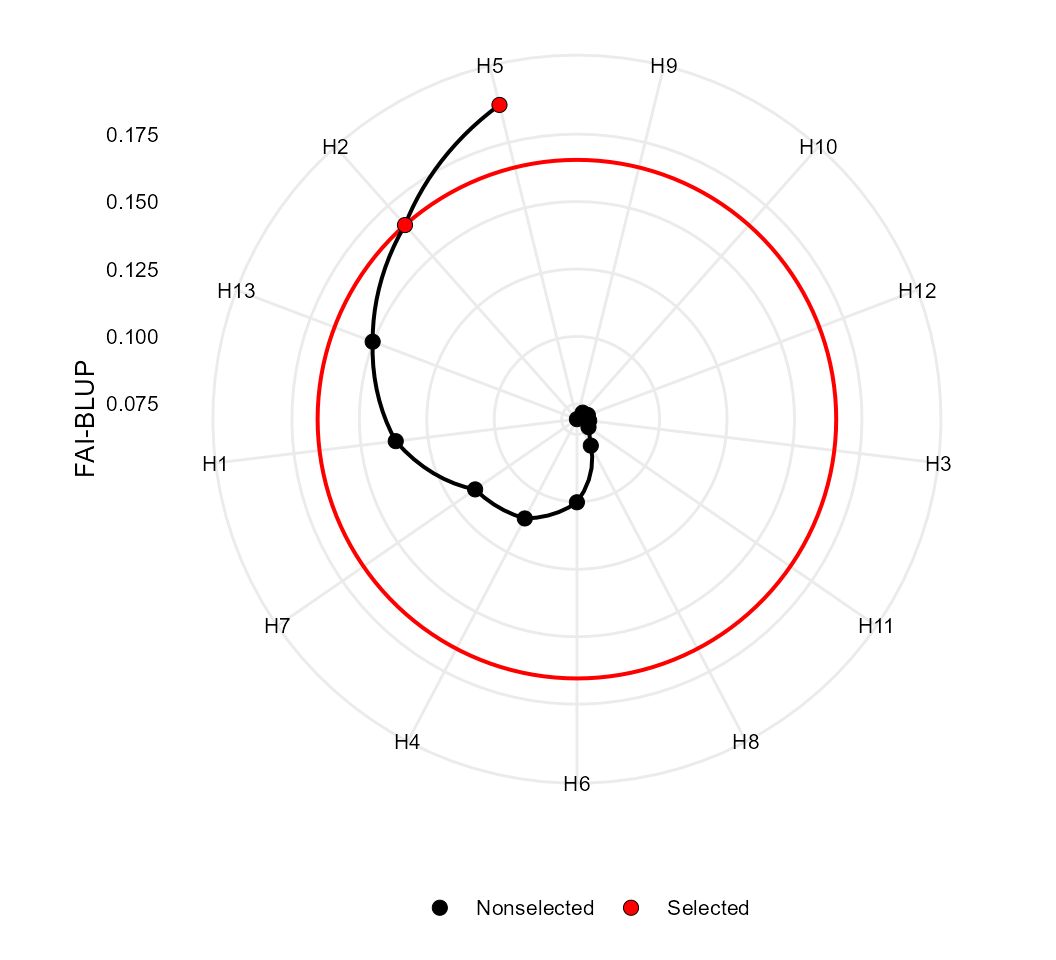
Comparing the indexes
The function coincidence_indexes() can be used to
compute the coincidence index described by Hamblin and Zimmermann (1986), among the multi-trait indexes
implemented in metan. To do that, just use a
comma-separated list of indexes as inpute data and inform the total
number of genotypes.
coincidence <- coincidence_index(mgidi_index, fai, smith, total = 13)
coincidence
# ---------------------------------------------------------------------------
# Coincidence index and common genotypes
# ---------------------------------------------------------------------------
# # A tibble: 3 × 5
#   V1          V2     index common genotypes
#   <chr>       <chr>  <dbl>  <int> <chr>
# 1 mgidi_index fai   100         3 H13,H5,H2
# 2 mgidi_index smith  56.71      2 H13,H5
# 3 fai         smith  56.71      2 H5,H13
We can also produce a Venn plot to show the relationships between the indexes
MGIDI <- gmd(mgidi_index, "sel_gen")
# Class of the model: mgidi
# Variable extracted: sel_gen
FAI <- gmd(fai, "sel_gen")
# Class of the model: fai_blup
# Variable extracted: sel_gen
SH <- gmd(smith, "sel_gen")
# Class of the model: sh
# Variable extracted: sel_gen

# Create the plot
venn_plot(MGIDI, FAI, SH, show_elements = TRUE)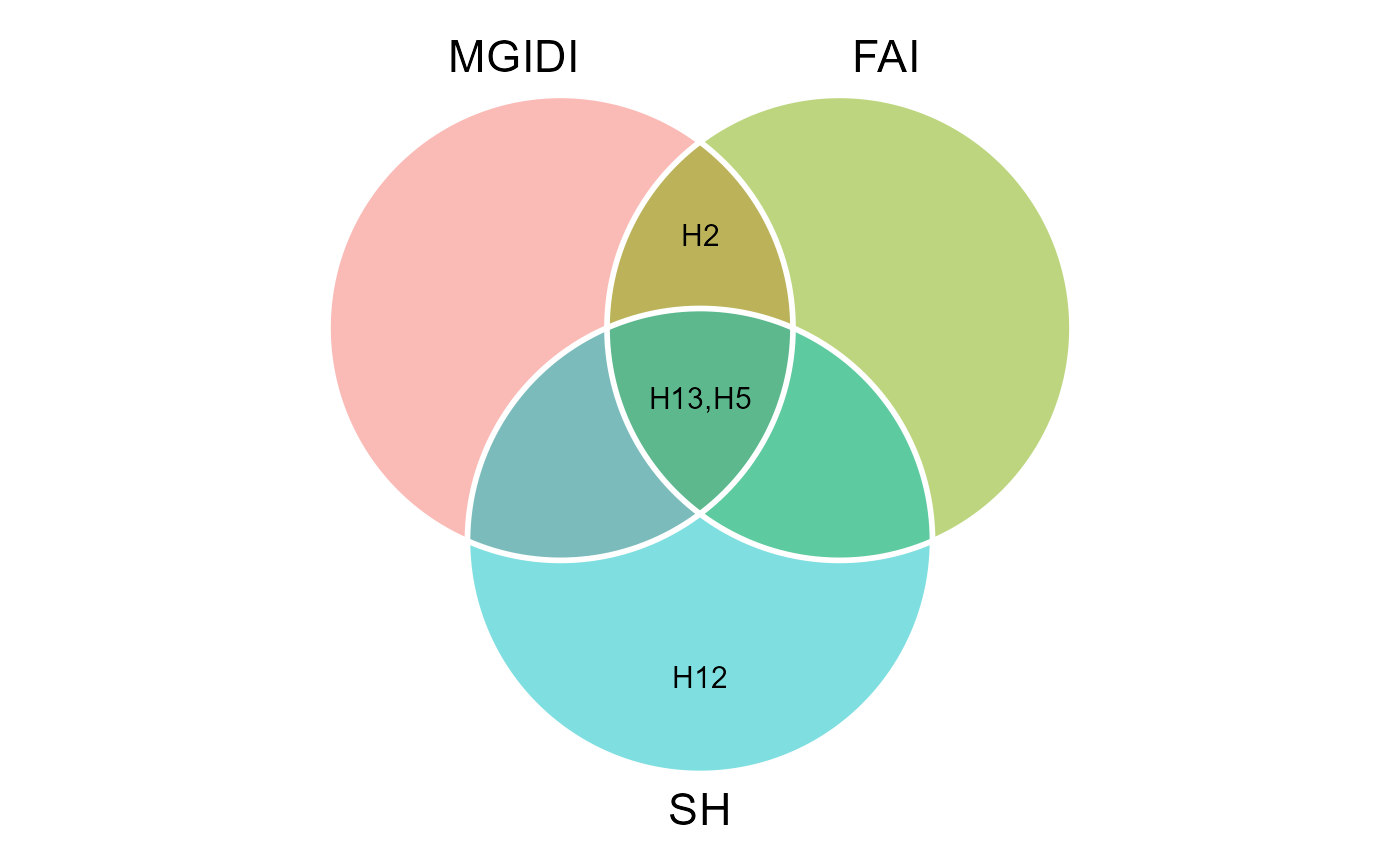
Rendering engine
This vignette was built with pkgdown. All tables were produced
with the package DT using the
following function.
library(DT) # Used to make the tables
# Function to make HTML tables
print_table <- function(table, rownames = FALSE, digits = 3, ...){
  df <- datatable(table, rownames = rownames, extensions = 'Buttons',
                  options = list(scrollX = TRUE,
                                 dom = '<<t>Bp>',
                                 buttons = c('copy', 'excel', 'pdf', 'print')), ...)
  num_cols <- c(as.numeric(which(sapply(table, class) == "numeric")))
  if(length(num_cols) > 0){
    formatSignif(df, columns = num_cols, digits = digits)
  } else{
    df
  }
}