![[Stable]](figures/lifecycle-stable.svg)
Produces ggplot2-based Venn plots for 2, 3 or 4 sets. A Venn diagram shows all possible logical relationships between several sets of data.
Usage
venn_plot(
  ...,
  names = NULL,
  show_elements = FALSE,
  show_sets = FALSE,
  fill = ggplot_color(4),
  alpha = 0.5,
  stroke_color = "white",
  stroke_alpha = 1,
  stroke_size = 1,
  stroke_linetype = "solid",
  name_color = "black",
  name_size = 6,
  text_color = "black",
  text_size = 4,
  label_sep = ","
)
Arguments
- ...
A list or a comma-separated list of vectors in the same class. If vector contains duplicates they will be discarded. If the list doesn't have names the sets will be named as
"set_1", "Set_2","Set_3"and so on. If vectors are given in..., the set names will be named with the names of the objects provided.- names
By default, the names of the sets are set as the names of the objects in
...(names = NULL). Usenamesto override this default.- show_elements
Show set elements instead of count. Defaults to
FALSE.- show_sets
Show set names instead of count. Defaults to
FALSE.- fill
Filling colors in circles. Defaults to the default ggplot2 color palette. A vector of length 1 will be recycled.
- alpha
Transparency for filling circles. Defaults to
0.5.- stroke_color
Stroke color for drawing circles.
- stroke_alpha
Transparency for drawing circles.
- stroke_size
Stroke size for drawing circles.
- stroke_linetype
Line type for drawing circles. Defaults to
"solid".- name_color
Text color for set names. Defaults to
"black".- name_size
Text size for set names.
- text_color
Text color for intersect contents.
- text_size
Text size for intersect contents.
- label_sep
The separator for labs when
show_elements = TRUE. Defaults to",".
Author
Tiago Olivoto tiagoolivoto@gmail.com
Examples
# \donttest{
library(metan)
(A <- letters[1:4])
#> [1] "a" "b" "c" "d"
(B <- letters[2:5])
#> [1] "b" "c" "d" "e"
(C <- letters[3:7])
#> [1] "c" "d" "e" "f" "g"
(D <- letters[4:12])
#> [1] "d" "e" "f" "g" "h" "i" "j" "k" "l"
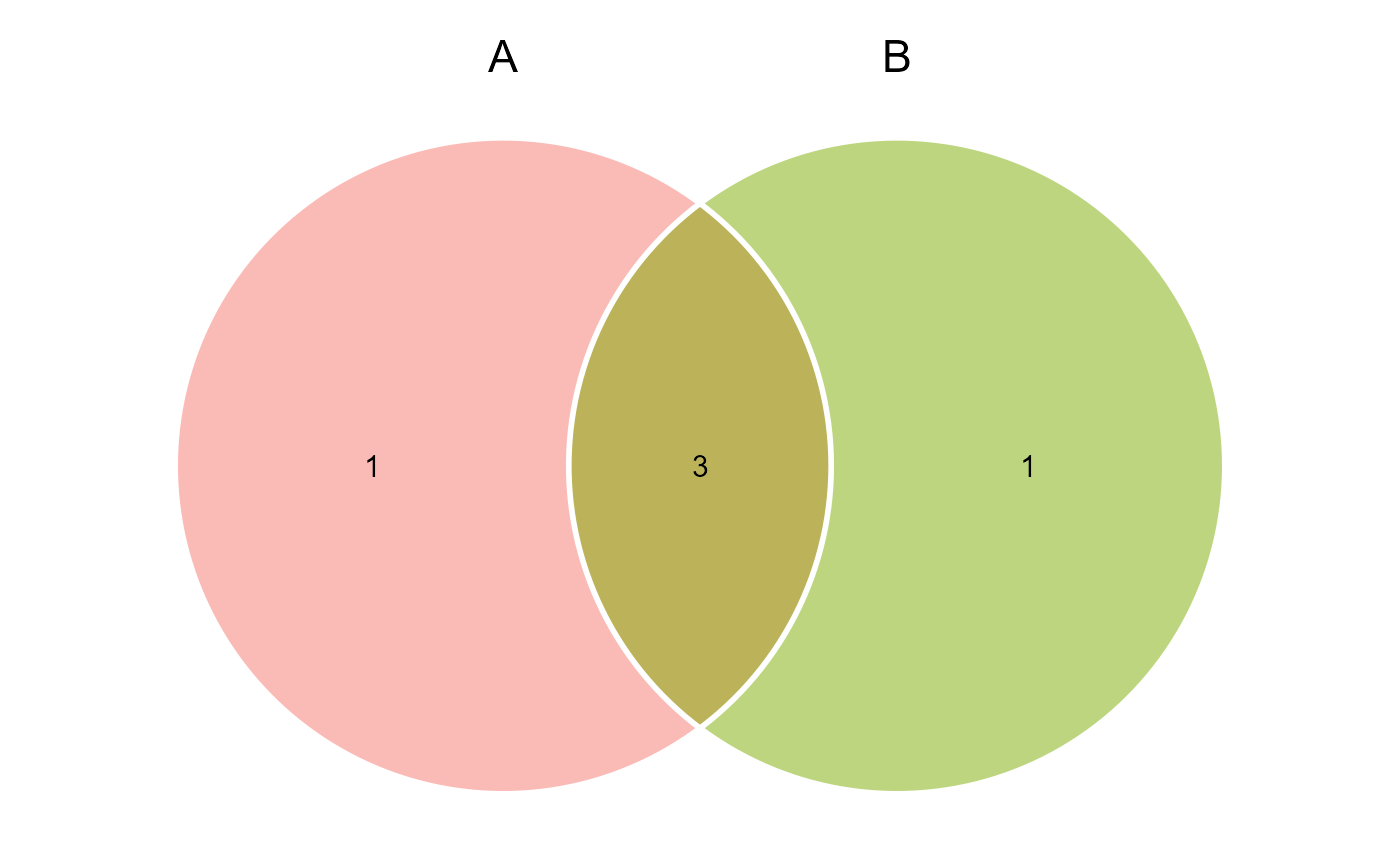
# create a Venn plot
venn_plot(A, B)
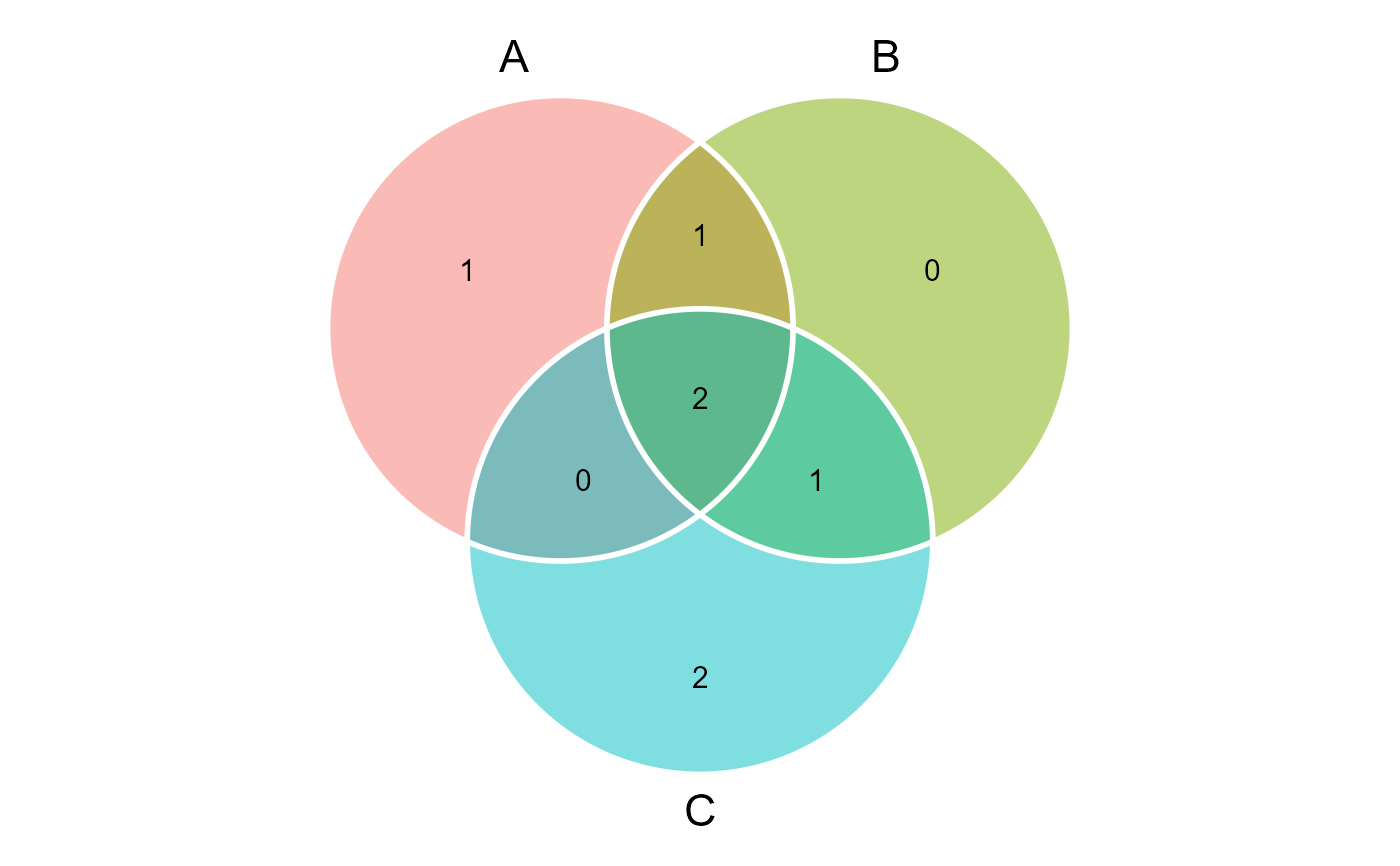
 # Three sets
venn_plot(A, B, C)
# Three sets
venn_plot(A, B, C)
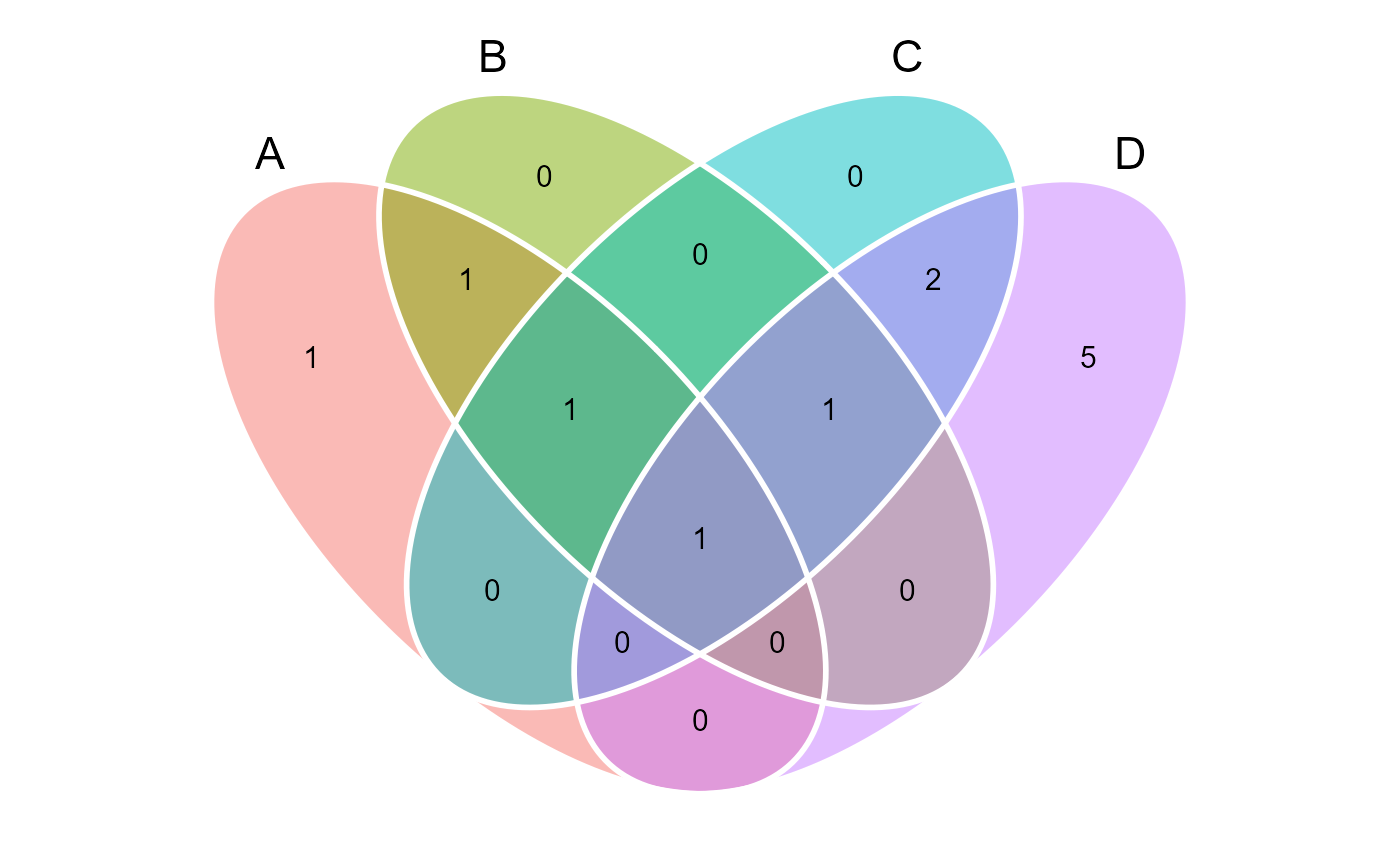
 # Four sets
venn_plot(A, B, C, D)
# Four sets
venn_plot(A, B, C, D)
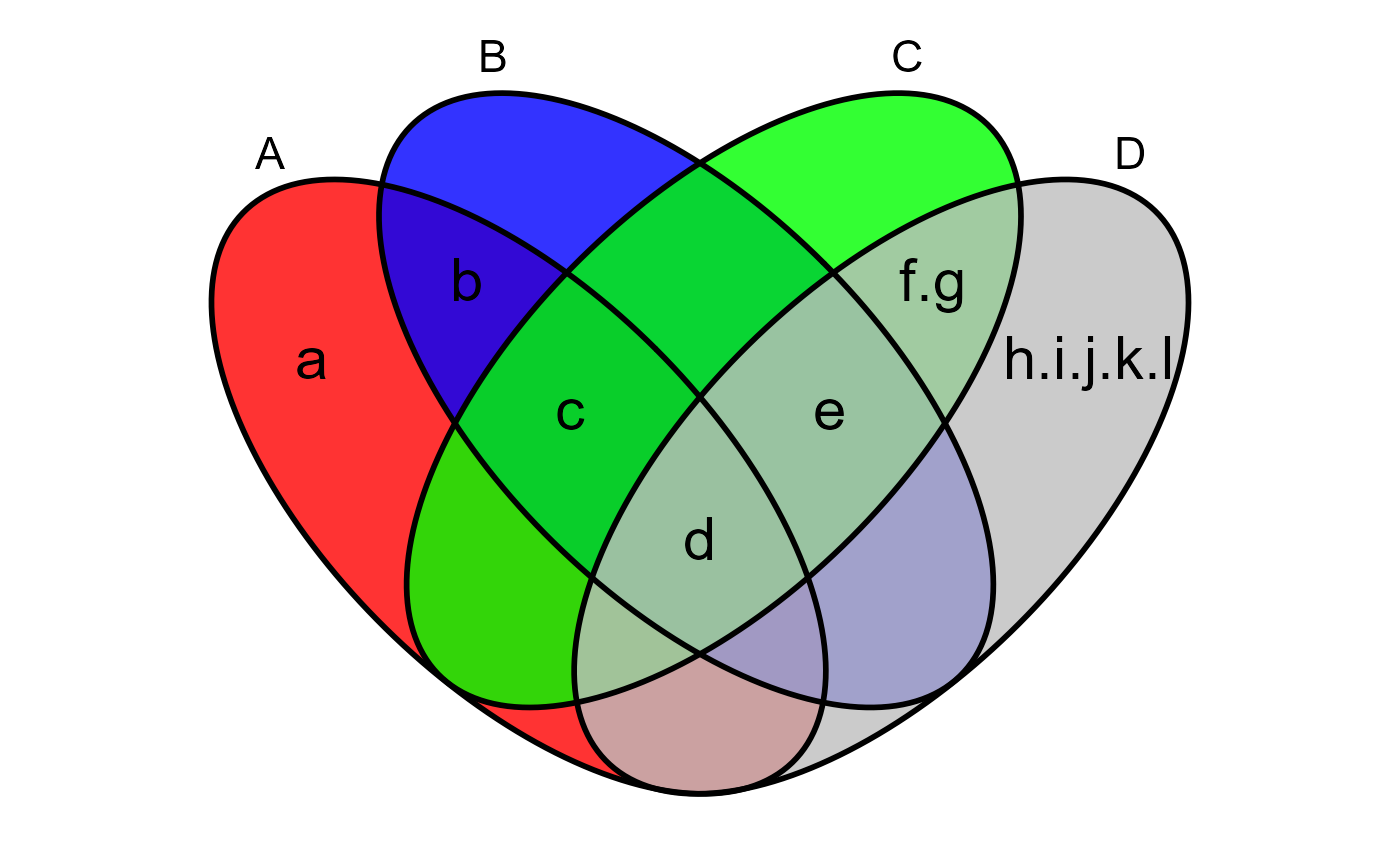
 # Use a list
dfs <- list(A = A, B = B, C = C, D = D)
venn_plot(dfs,
show_elements = TRUE,
fill = c("red", "blue", "green", "gray"),
stroke_color = "black",
alpha = 0.8,
text_size = 8,
label_sep = ".")
# Use a list
dfs <- list(A = A, B = B, C = C, D = D)
venn_plot(dfs,
show_elements = TRUE,
fill = c("red", "blue", "green", "gray"),
stroke_color = "black",
alpha = 0.8,
text_size = 8,
label_sep = ".")
 # }
# }