![[Stable]](figures/lifecycle-stable.svg)
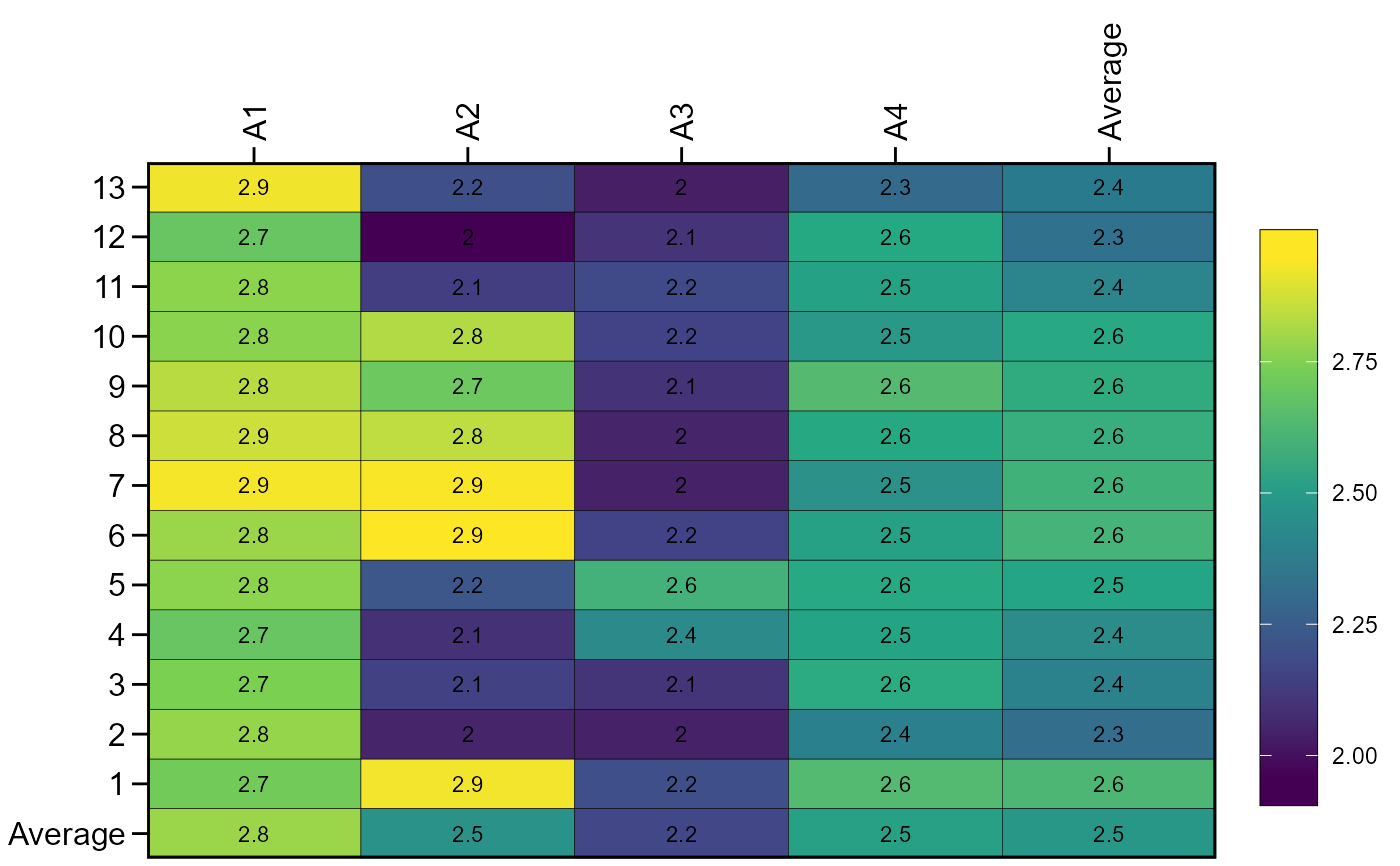
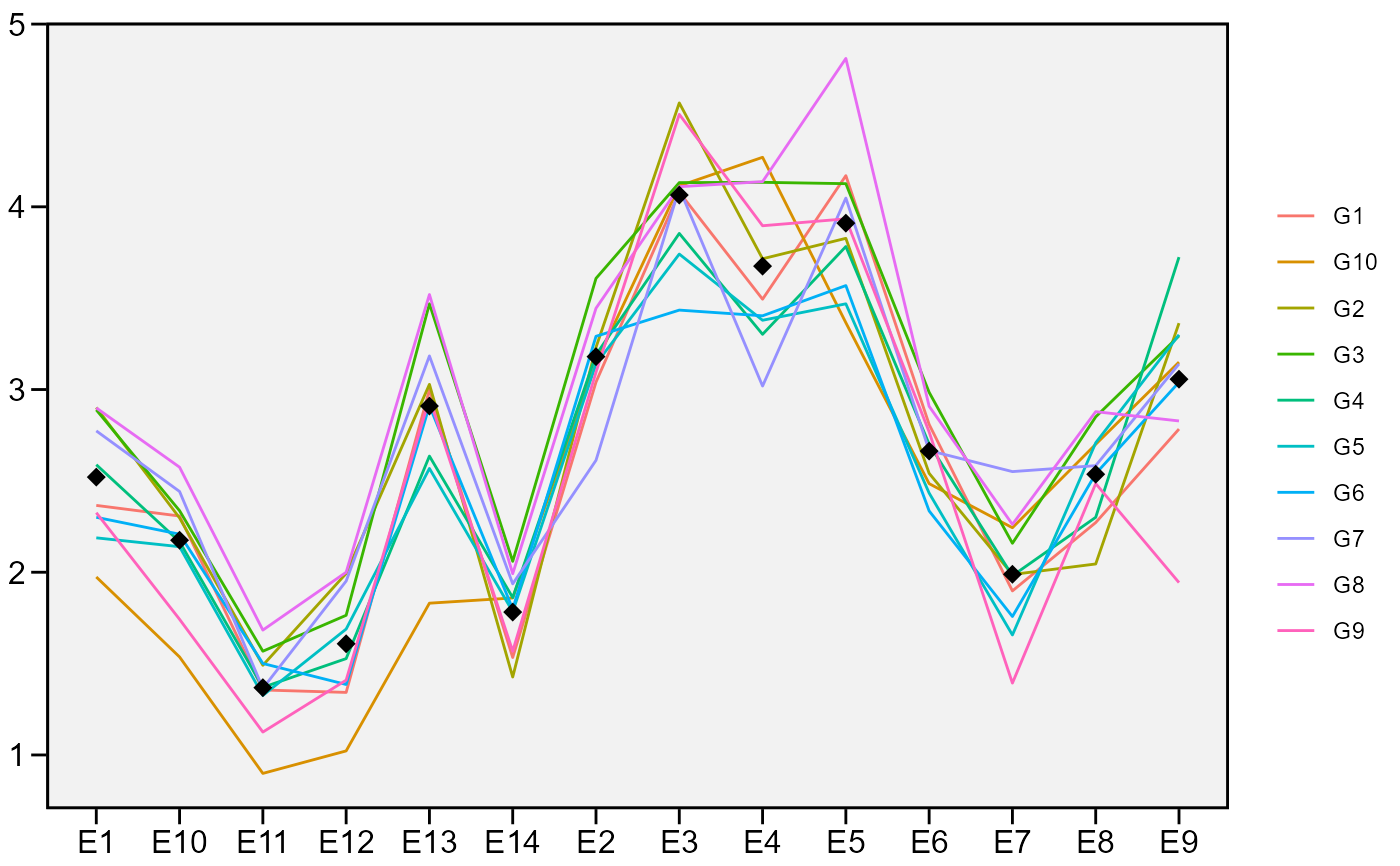
This function produces a line plot for a graphical interpretation of the genotype-vs-environment interaction. By default, environments are in the x axis whereas the genotypes are depicted by different lines. The y axis contains the value of the selected variable. A heatmap can also be created.
Usage
ge_plot(
  .data,
  env,
  gen,
  resp,
  type = 1,
  values = TRUE,
  text_col_pos = c("top", "bottom"),
  text_row_pos = c("left", "right"),
  average = TRUE,
  order_g = NULL,
  order_e = NULL,
  xlab = NULL,
  ylab = NULL,
  width_bar = 1.5,
  heigth_bar = 15,
  plot_theme = theme_metan(),
  colour = TRUE
)
Arguments
- .data
The dataset containing the columns related to Environments, Genotypes, replication/block and response variable(s).
- env
The name of the column that contains the levels of the environments
- gen
The name of the column that contains the levels of the genotypes.
- resp
The response variable.
- type
The type of plot
type = 1for a heatmap ortype = 2for a line plot.- values
Show the values in the plot? Defaults to
TRUE.- text_row_pos, text_col_pos
The position of the text in the rows and columns. The defaults show the text at left and top.
- average
Show the average values for environments and genotypes? Defaults to
TRUE.- order_g, order_e
A charactere vector indicating the order of the levels for genotypes and environments, respectively. This can be used to change the default ordering of rows and columns.
- xlab, ylab
The labels for x and y axis, respectively.
- width_bar, heigth_bar
The width and heigth of the legend bar, respectively.
- plot_theme
The graphical theme of the plot. Default is
plot_theme = theme_metan(). For more details,seeggplot2::theme().- colour
Logical argument. If
FALSEthen the plot will not be colored.
Author
Tiago Olivoto tiagoolivoto@gmail.com