![[Stable]](figures/lifecycle-stable.svg)
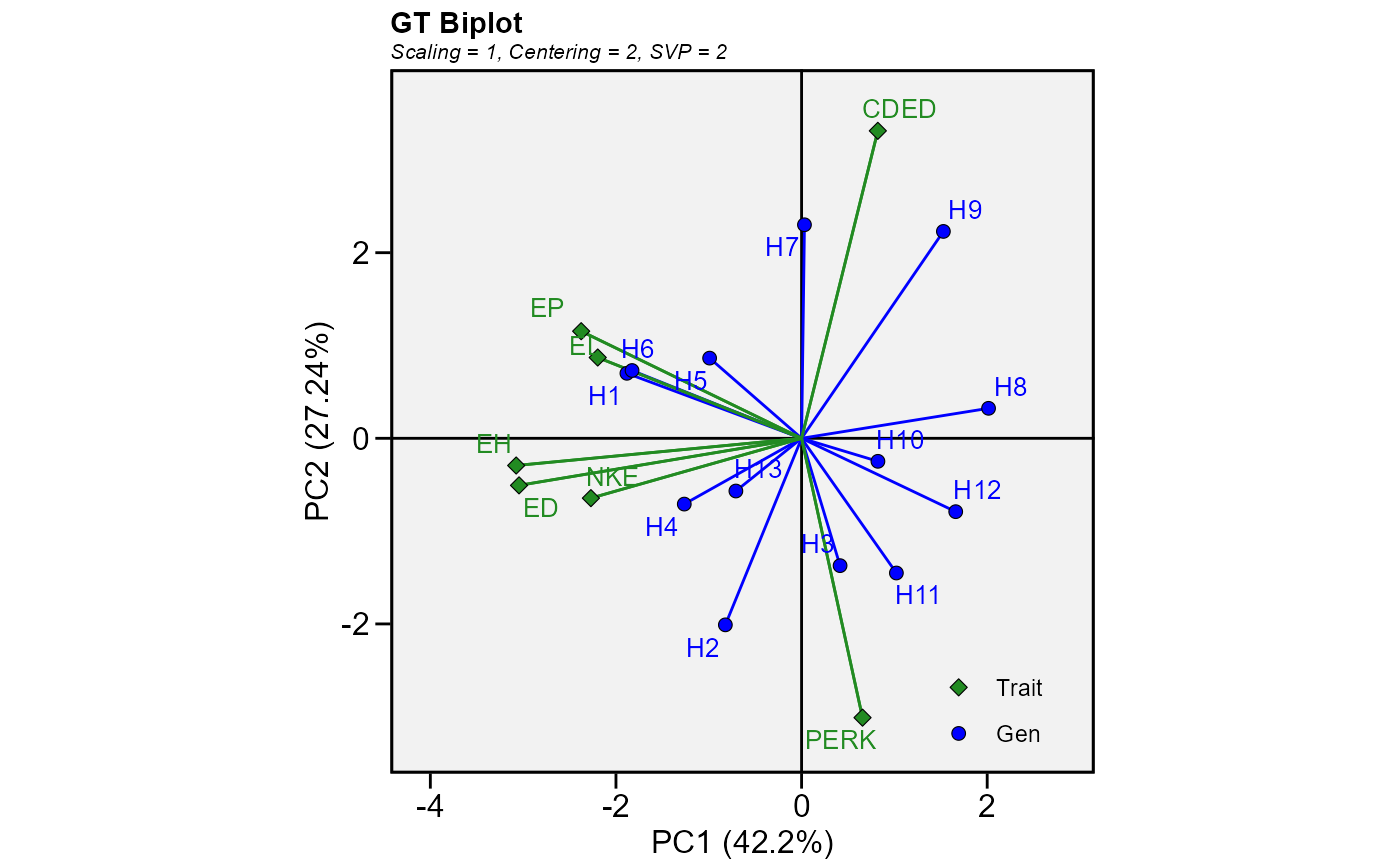
Produces a genotype-by-trait biplot model. From a genotype by environment by trait three-way table, genotype-by-trait tables in any single environment, across all environments, or across a subset of the environments can be generated and visually studied using biplots. The model for biplot analysis of genotype by trait data is the singular value decomposition of trait-standardized two-way table.
Arguments
- .data
The dataset containing the columns related to Genotypes and the response variable(s).
- gen
The name of the column that contains the levels of the genotypes.
- resp
The response variables, i.e.,
resp = c(var1, var2, var3). Select helpers can also be used.- centering
The centering method. Must be one of the
'none | 0', for no centering;'global | 1', for global centered (T+G+GT);'trait | 2'(default), for trait-centered (G+GT); or'double | 3', for double centred (GT). A biplot cannot be produced with models produced without centering.- scaling
The scaling method. Must be one of the
'none | 0', for no scaling; or'sd | 1'(default), where each value is divided by the standard deviation of its corresponding trait (column). This will put all traits roughly he same rang of values.- svp
The method for singular value partitioning. Must be one of the
'genotype | 1', (The singular value is entirely partitioned into the genotype eigenvectors, also called row metric preserving);'trait | 2', default, (The singular value is entirely partitioned into the trait eigenvectors, also called column metric preserving); or'symmetrical | 3'(The singular value is symmetrically partitioned into the genotype and the trait eigenvectors This SVP is most often used in AMMI analysis and other biplot analysis, but it is not ideal for visualizing either the relationship among genotypes or that among the traits).
Value
The function returns a list of class gge that is compatible with the function plot() used in gge().
coordgen The coordinates for genotypes for all components.
coordenv The coordinates for traits for all components.
eigenvalues The vector of eigenvalues.
totalvar The overall variance.
labelgen The name of the genotypes.
labelenv The names of the traits.
labelaxes The axes labels.
gt_mat The data used to produce the model (scaled and centered).
centering The centering method.
scaling The scaling method.
svp The singular value partitioning method.
d The factor used to generate in which the ranges of genotypes and traits are comparable when singular value partitioning is set to 'genotype' or 'trait'.
grand_mean The grand mean of the trial.
mean_gen A vector with the means of the genotypes.
mean_env A vector with the means of the traits.
scale_var The scaling vector when the scaling method is
'sd'.
References
Yan, W., and M.S. Kang. 2003. GGE biplot analysis: a graphical tool for breeders, geneticists, and agronomists. CRC Press.
Author
Tiago Olivoto tiagoolivoto@gmail.com