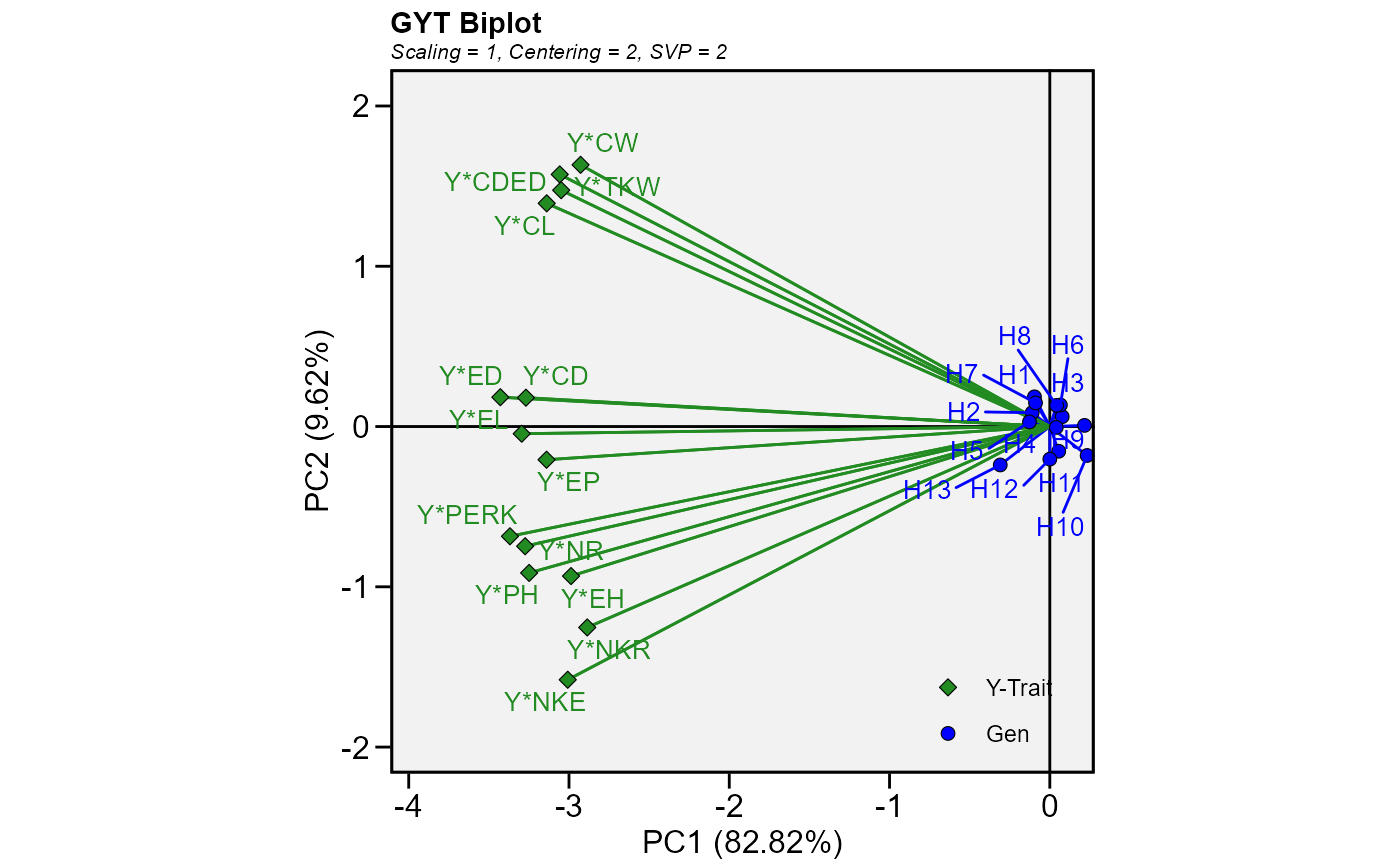
Usage
gytb(
  .data,
  gen,
  yield,
  traits = everything(),
  ideotype = NULL,
  weight = NULL,
  prefix = "Y",
  centering = "trait",
  scaling = "sd",
  svp = "trait"
)
Arguments
- .data
The dataset containing the columns related to Genotypes, Yield, and Traits.
- gen
The name of the column that contains the levels of the genotypes.
- yield
The column containing the yield values.
- traits
The column(s) with the traits values. Defaults to NULL. In this case, all numeric traits in
.data, except that inyieldare selected. To select specific traits from.data, use a list of unquoted comma-separated variable names (e.g. traits = c(var1, var2, var3)), an specific range of variables, (e.g. traits = c(var1:var3)), or even a select helper likestarts_with("N").- ideotype
A vector of
"h"or"l"with the same length oftraitsto define which trait is desired to increase or decrease. By default (ideotype = NULL) for all numeric traits intraitsare assumed that high values is desirable. Following the order of the traits selected intraits, use"h"to indicate the traits in which higher values are desired or"l"to indicate the variables in which lower values are desired. Then,yieldwill be multiplied by traits with"h"and divided by traits with"l"to generate the Genotype by yield*trait table. For example,ideotype = c("h, h, l")will assume that the ideotype has higher values for the first two traits and lower values for the last trait.- weight
The weight assumed for each trait. Similar to
ideotypeargument, provide a numeric vector of the same length oftraits. Suggested values are between 0 and 2.- prefix
The prefix used in the biplot for the yield*trait combinations. Defaults to
"Y".- centering
The centering method. Must be one of the
'none | 0', for no centering;'global | 1', for global centered (T+G+GYT);'trait | 2'(default), for trait-centered (G+GYT); or'double | 3', for double centered (GYT). A biplot cannot be produced with models produced without centering.- scaling
The scaling method. Must be one of the
'none | 0', for no scaling; or'sd | 1'(default), so that the mean for each trait or yield-trait combination becomes 0 and the variance becomes unit.- svp
The method for singular value partitioning. Must be one of the
'genotype | 1', (The singular value is entirely partitioned into the genotype eigenvectors, also called row metric preserving);'trait | 2', default, (The singular value is entirely partitioned into the trait eigenvectors, also called column metric preserving); or'symmetrical | 3'(The singular value is symmetrically partitioned into the genotype and the trait eigenvectors This SVP is most often used in AMMI analysis and other biplot analysis, but it is not ideal for visualizing either the relationship among genotypes or that among the traits).
Value
The function returns a list of class gge that is compatible with the function plot() used in gge().
data The Genotype by yield\*trait (GYT) data.
ge_mat The Genotype by yield\*trait (GYT) data (scaled and centered).
coordgen The coordinates for genotypes for all components.
coordenv The coordinates for traits for all components.
eigenvalues The vector of eigenvalues.
totalvar The overall variance.
labelgen The name of the genotypes.
labelenv The names of the traits.
labelaxes The axes labels.
centering The centering method.
scaling The scaling method.
svp The singular value partitioning method.
d The factor used to generate in which the ranges of genotypes and traits are comparable when singular value partitioning is set to 'genotype' or 'trait'.
grand_mean The grand mean of the trial.
mean_gen A vector with the means of the genotypes.
mean_env A vector with the means of the traits.
scale_var The scaling vector when the scaling method is
'sd'.
References
Yan, W., & Fregeau-Reid, J. (2018). Genotype by Yield\*Trait (GYT) Biplot: a Novel Approach for Genotype Selection based on Multiple Traits. Scientific Reports, 8(1), 1-10. doi:10.1038/s41598-018-26688-8
Author
Tiago Olivoto tiagoolivoto@gmail.com

