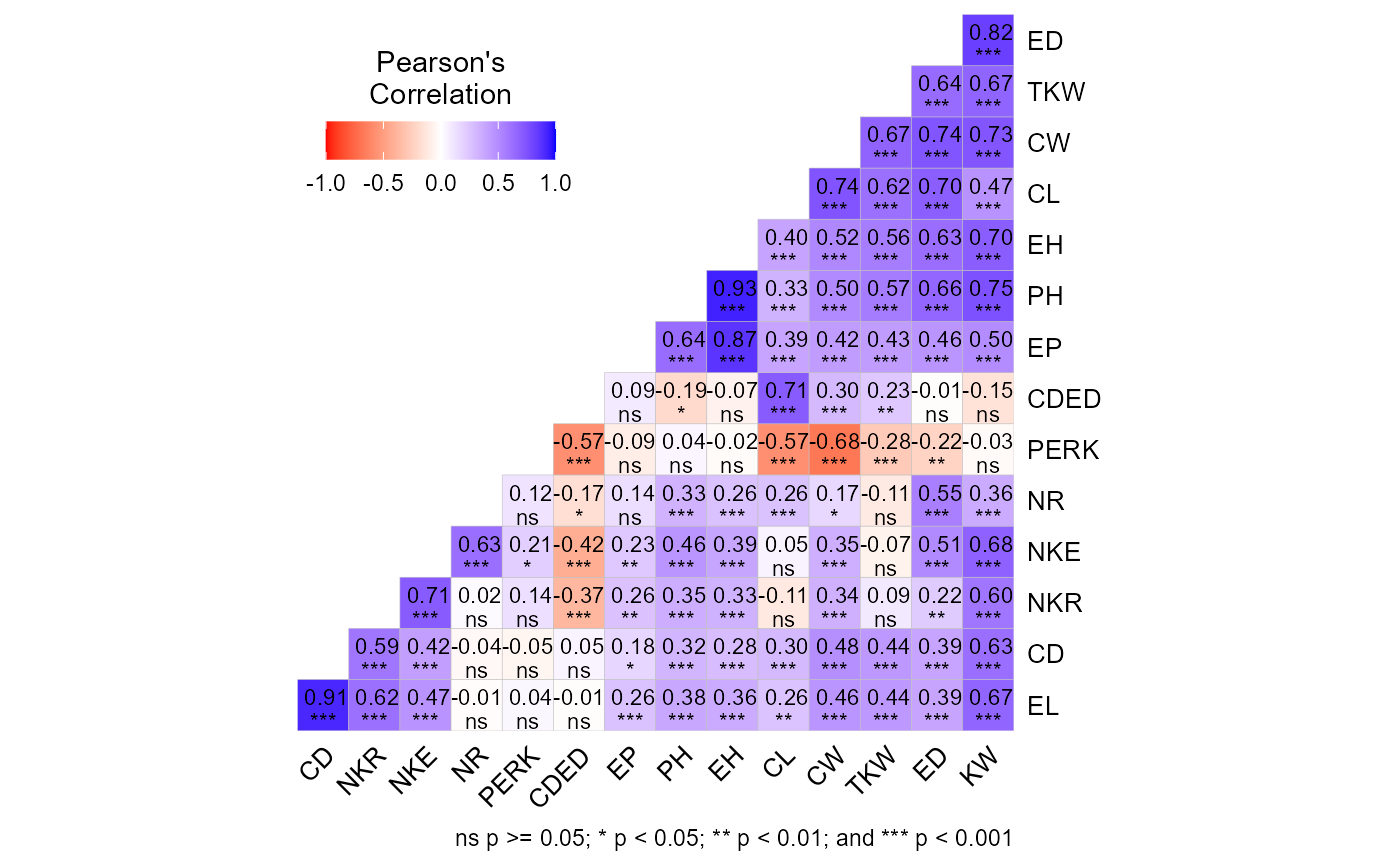
Create a correlation heat map for object of class corr_coef
Usage
# S3 method for corr_coef
plot(
  x,
  type = "lower",
  diag = FALSE,
  reorder = TRUE,
  signif = c("stars", "pval"),
  show = c("all", "signif"),
  p_val = 0.05,
  caption = TRUE,
  digits.cor = 2,
  digits.pval = 3,
  col.low = "red",
  col.mid = "white",
  col.high = "blue",
  lab.x.position = NULL,
  lab.y.position = NULL,
  legend.position = NULL,
  legend.title = "Pearson's\nCorrelation",
  size.text.cor = 3,
  size.text.signif = 3,
  size.text.lab = 10,
  ...
)
Arguments
- x
The data set.
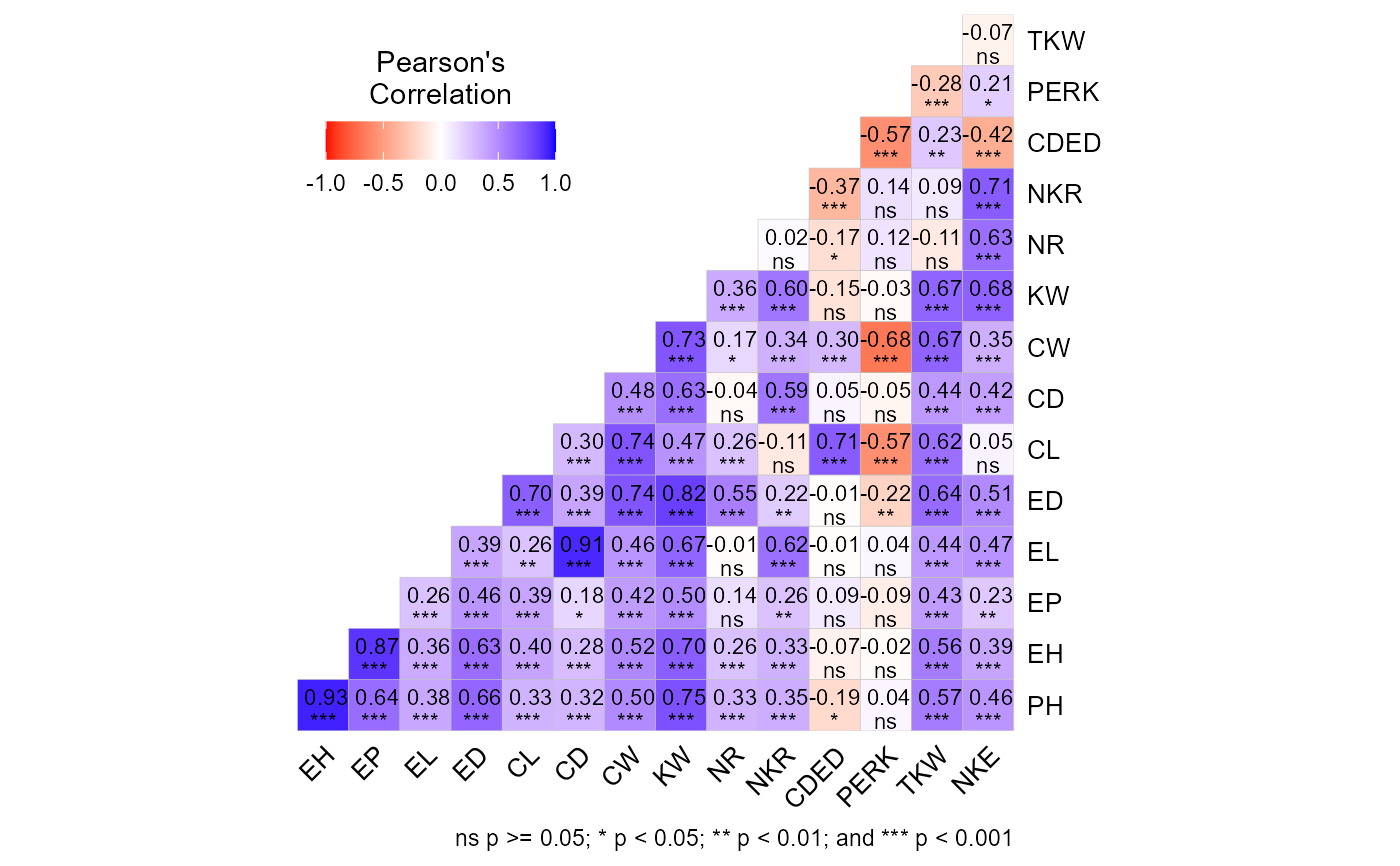
- type
The type of heat map to produce. Either
lower(default) to produce a lower triangle heat map orupperto produce an upper triangular heat map.- diag
Plot diagonal elements? Defaults to
FALSE.- reorder
Reorder the correlation matrix to identify the hidden pattern? Defaults to
TRUE.- signif
How to show significant correlations. If
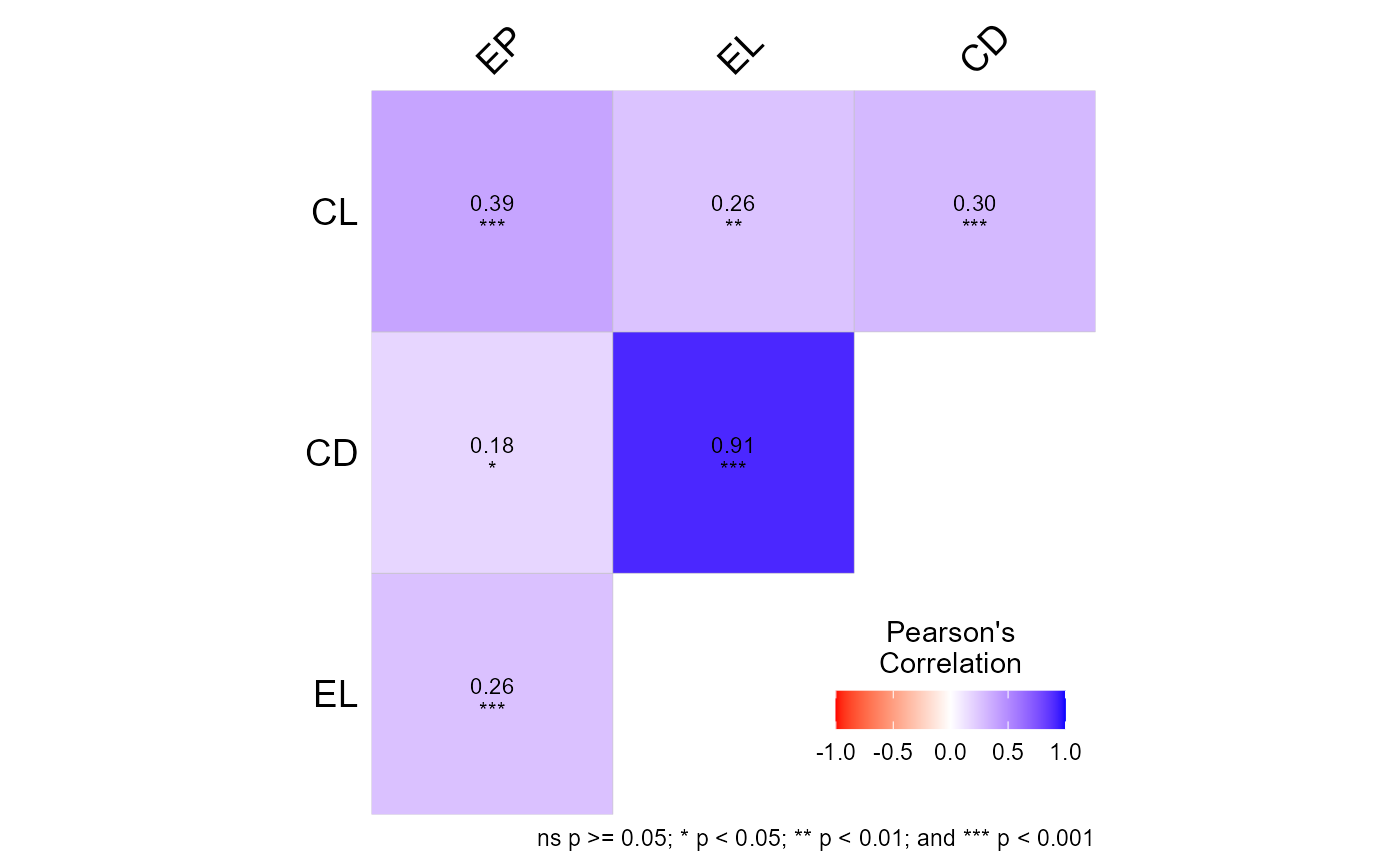
"stars"is used (default), stars are used showing the significance at 0.05 (""), 0.01 ("") and 0.001 ("") probability error. Ifsignif = "pval", then the p-values are shown.- show
The correlations to show. Either
all(default) orsignif(only significant correlations).- p_val
The p-value to the correlation significance.
- caption
Logical. If
TRUE(Default) includes a caption with the significance meaning for stars.- digits.cor, digits.pval
The significant digits to show for correlations and p-values, respectively.
- col.low, col.mid, col.high
The color for the low (-1), mid(0) and high (1) points in the color key. Defaults to
blue,white, andred, respectively.- lab.x.position, lab.y.position
The position of the x and y axis label. Defaults to
"bottom"and"right"iftype = "lower"or"top"and"left"iftype = "upper".- legend.position
The legend position in the plot.
- legend.title
The title of the color key. Defaults to
"Pearson's Correlation".- size.text.cor
The size of the text for correlation values. Defaults to 3.
- size.text.signif
The size of the text for significance values (stars or p-values). Defaults to 3.
- size.text.lab
The size of the text for labels. Defaults to 10.
- ...
Currently not used.
Author
Tiago Olivoto tiagoolivoto@gmail.com