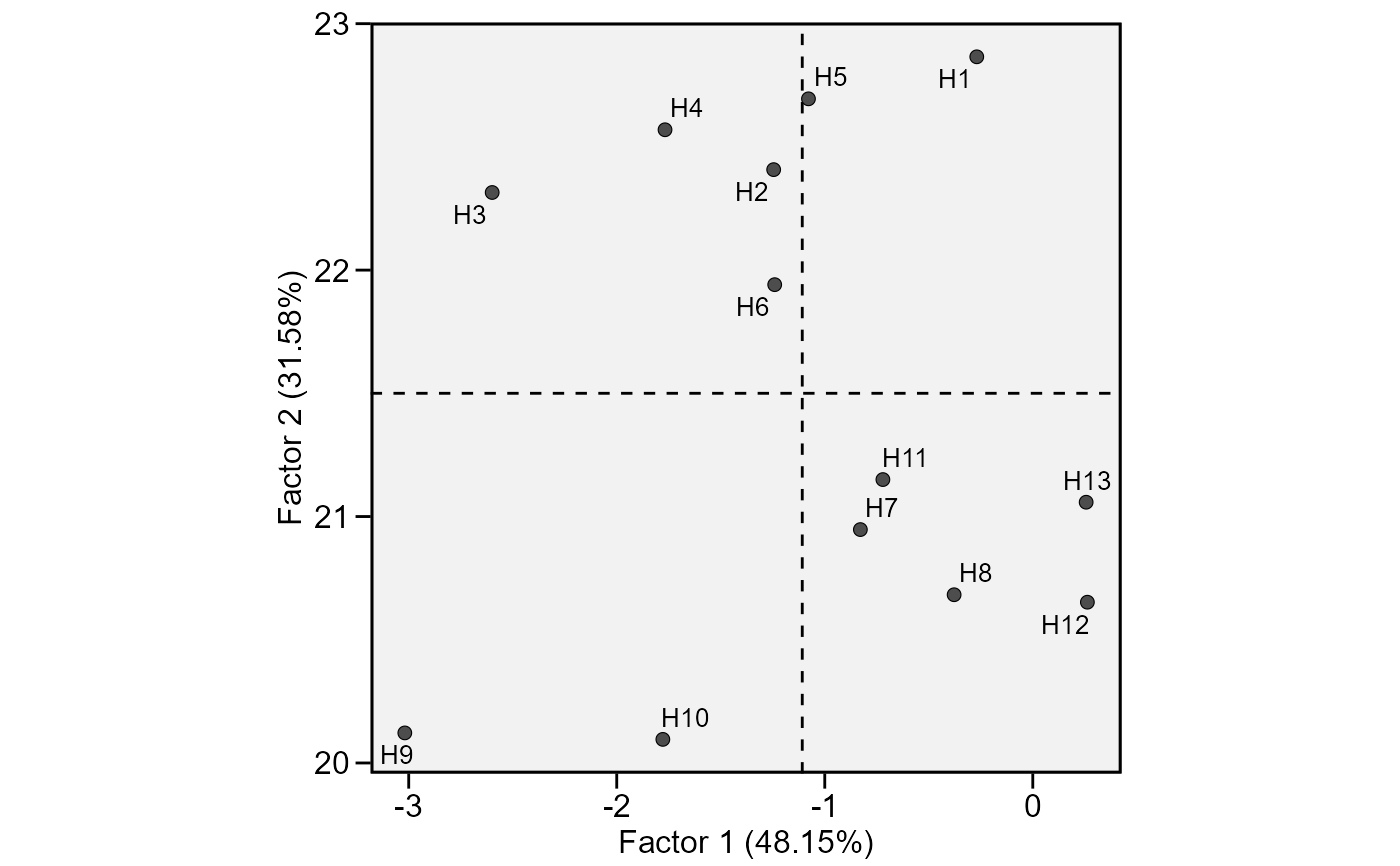
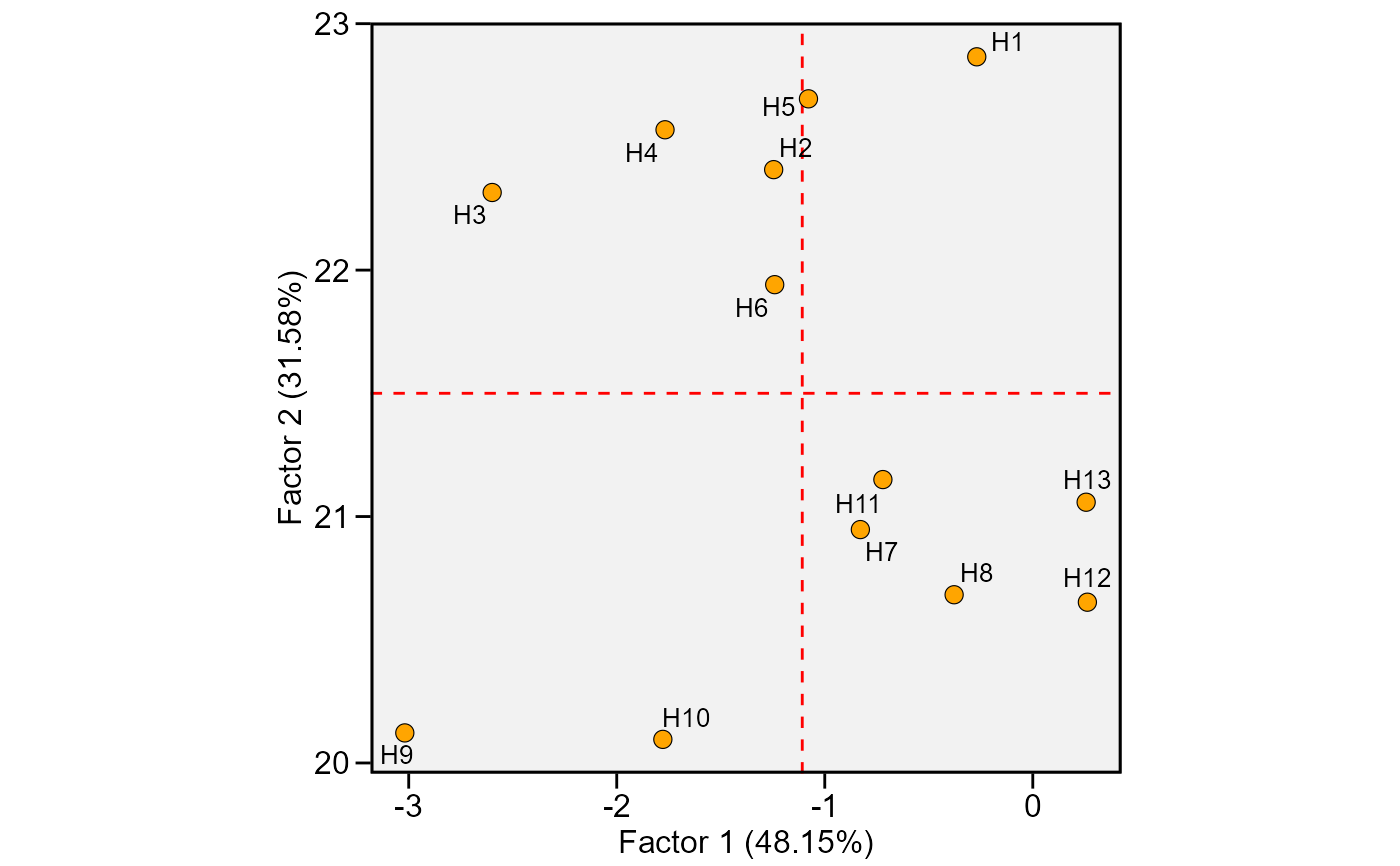
This function plot the scores for genotypes obtained in the factor analysis to interpret the stability
Usage
# S3 method for ge_factanal
plot(
  x,
  var = 1,
  plot_theme = theme_metan(),
  x.lim = NULL,
  x.breaks = waiver(),
  x.lab = NULL,
  y.lim = NULL,
  y.breaks = waiver(),
  y.lab = NULL,
  shape = 21,
  col.shape = "gray30",
  col.alpha = 1,
  size.shape = 2.2,
  size.bor.tick = 0.3,
  size.tex.lab = 12,
  size.tex.pa = 3.5,
  force.repel = 1,
  line.type = "dashed",
  line.alpha = 1,
  col.line = "black",
  size.line = 0.5,
  ...
)
Arguments
- x
An object of class
ge_factanal- var
The variable to plot. Defaults to
var = 1the first variable ofx.- plot_theme
The graphical theme of the plot. Default is
plot_theme = theme_metan(). For more details, seeggplot2::theme().- x.lim
The range of x-axis. Default is
NULL(maximum and minimum values of the data set). New arguments can be inserted asx.lim = c(x.min, x.max).- x.breaks
The breaks to be plotted in the x-axis. Default is
authomatic breaks. New arguments can be inserted asx.breaks = c(breaks)- x.lab
The label of x-axis. Each plot has a default value. New arguments can be inserted as
x.lab = "my label".- y.lim
The range of x-axis. Default is
NULL. The same arguments thanx.limcan be used.- y.breaks
The breaks to be plotted in the x-axis. Default is
authomatic breaks. The same arguments thanx.breakscan be used.- y.lab
The label of y-axis. Each plot has a default value. New arguments can be inserted as
y.lab = "my label".- shape
The shape for genotype indication in the plot. Default is
1(circle). Values between21-25:21(circle),22(square),23(diamond),24(up triangle), and25(low triangle) allows a color for fill the shape.- col.shape
The shape color for genotypes. Must be one value or a vector of colors with the same length of the number of genotypes. Default is
"gray30". Other values can be attributed. For example,transparent_color(), will make a plot with only an outline around the shape area.- col.alpha
The alpha value for the color. Default is
1. Values must be between0(full transparency) to1(full color).- size.shape
The size of the shape (both for genotypes and environments). Default is
2.2.- size.bor.tick
The size of tick of shape. Default is
0.3. The size of the shape will besize.shape + size.bor.tick- size.tex.lab
The size of the text in the axes text and labels. Default is
12.- size.tex.pa
The size of the text of the plot area. Default is
3.5.- force.repel
Force of repulsion between overlapping text labels. Defaults to 1.
- line.type
The type of the line that indicate the means in the biplot. Default is
"solid". Other values that can be attributed are:"blank", no lines in the biplot,"dashed", "dotted", "dotdash", "longdash", and "twodash".- line.alpha
The alpha value that combine the line with the background to create the appearance of partial or full transparency. Default is
0.4. Values must be between "0" (full transparency) to "1" (full color).- col.line
The color of the line that indicate the means in the biplot. Default is
"gray"- size.line
The size of the line that indicate the means in the biplot. Default is
0.5.- ...
Currently not used..
Author
Tiago Olivoto tiagoolivoto@gmail.com