Interpolates supplementary landmarks that correspond to the mean coordinates of two adjacent landmarks.
Arguments
- x
A
matrix, adata.framealistof perimeter coordinates, often produced withobject_contour(),landmarks(), orlandmarks_regradi().- n
The number of iterations. Defaults to 3.
- smooth_iter
The number of smoothing iterations to perform. This will smooth the perimeter of the interpolated landmarks using
poly_smooth().- plot
Creates a plot? Defaults to
TRUE.- ncol, nrow
The number of rows or columns in the plot grid when a
listis used inx. Defaults toNULL, i.e., a square grid is produced.
Examples
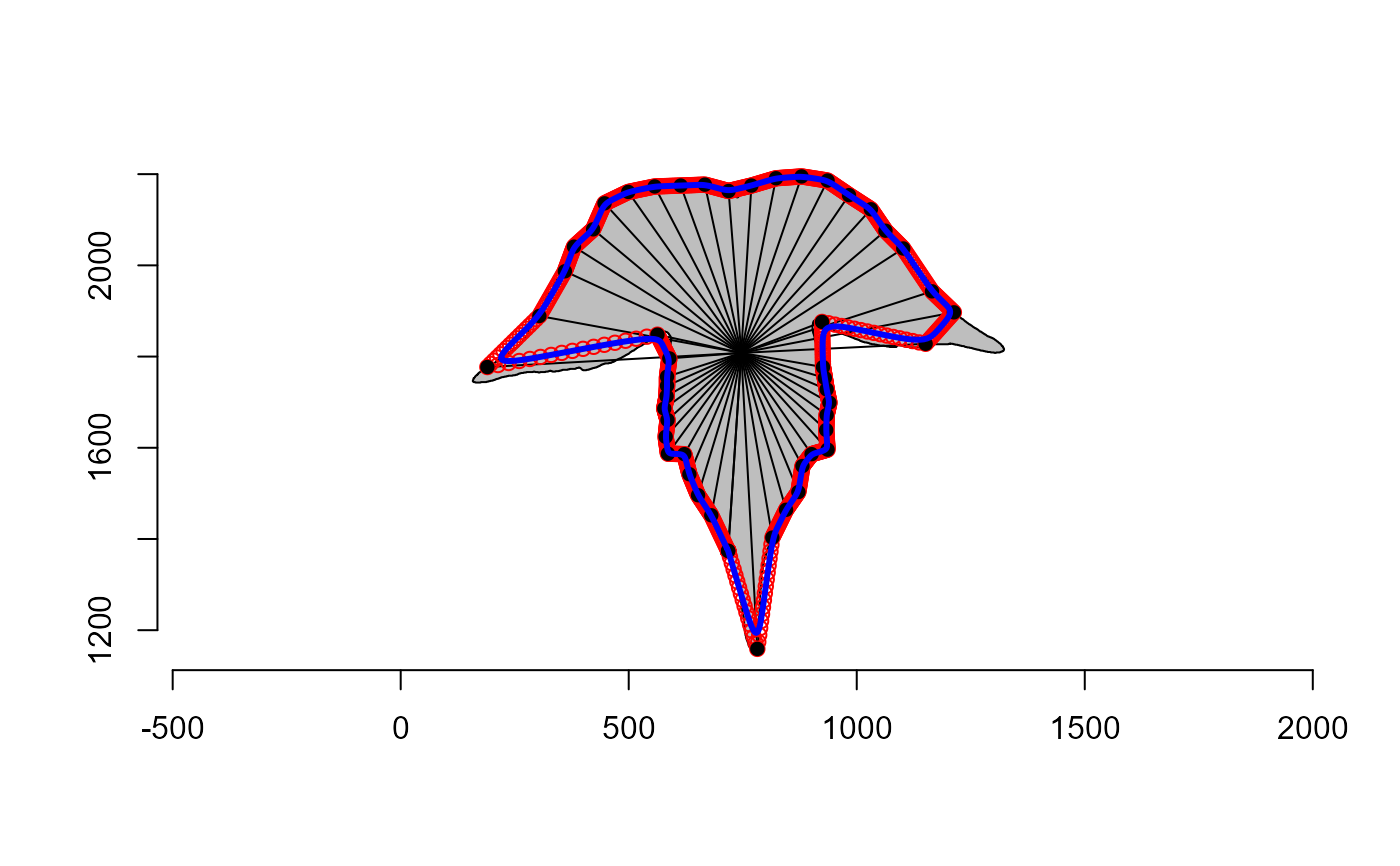
library(pliman)

# equally spaced landmarks
plot_polygon(contours[[4]])
ldm <- landmarks_regradi(contours[[4]], plot = FALSE)
points(ldm$coords, pch = 16)
segments(mean(ldm$coords[,1]),
         mean(ldm$coords[,2]),
         ldm$coords[,1],
         ldm$coords[,2])

ldm_add <- landmarks_add(ldm, plot = FALSE)
points(ldm_add, col = "red")
points(ldm$coords, pch = 16)

# smoothed version
ldm_add_smo <- landmarks_add(ldm, plot = FALSE, smooth_iter = 10)
lines(ldm_add_smo, col = "blue", lwd = 3)