This function calculates the Perimeter Complexity Value (PCV) for a given set
of coordinates representing a contour. The PCV measures the variation of
distances between the original coordinates and the smoothed coordinates
relative to the perimeter length of the original contour. See more in
details section.
Arguments
- x
A matrix or a list of matrices representing the coordinates of the polygon(s).
- niter
An integer specifying the number of smoothing iterations. See
poly_smooth()for more details.
Value
The PCV value(s) computed for the contour(s).
If x is a matrix, returns the complexity value of the polygon's
perimeter. If x is a list of matrices, returns a numeric vector of
complexity values for each polygon.
Details
The PCV is computed using the following formula: $$PCV = \frac{sum(dists) \times sd(dists)}{perim}$$ where \(dists\) represents the distances between corresponding points in the original and smoothed coordinates, and \(perim\) is the perimeter length of the smoothed contour.
The PCV is computed by first smoothing the input contour using a specified number of iterations. The smoothed contour is then used to compute the distances between corresponding points in the original and smoothed coordinates. These distances reflect the variations in the contour shape after smoothing. The sum of these distances represents the overall magnitude of the variations. Next, the sum of distances is multiplied by the standard deviation of the distances to capture the dispersion or spread of the variations. Finally, this value is divided by the perimeter length of the original contour to provide a relative measure of complexity. Therefore, the PCV provides a relative measure of complexity by considering both the magnitude and spread of the variations in the contour shape after smoothing.
Examples
library(pliman)
set.seed(20)
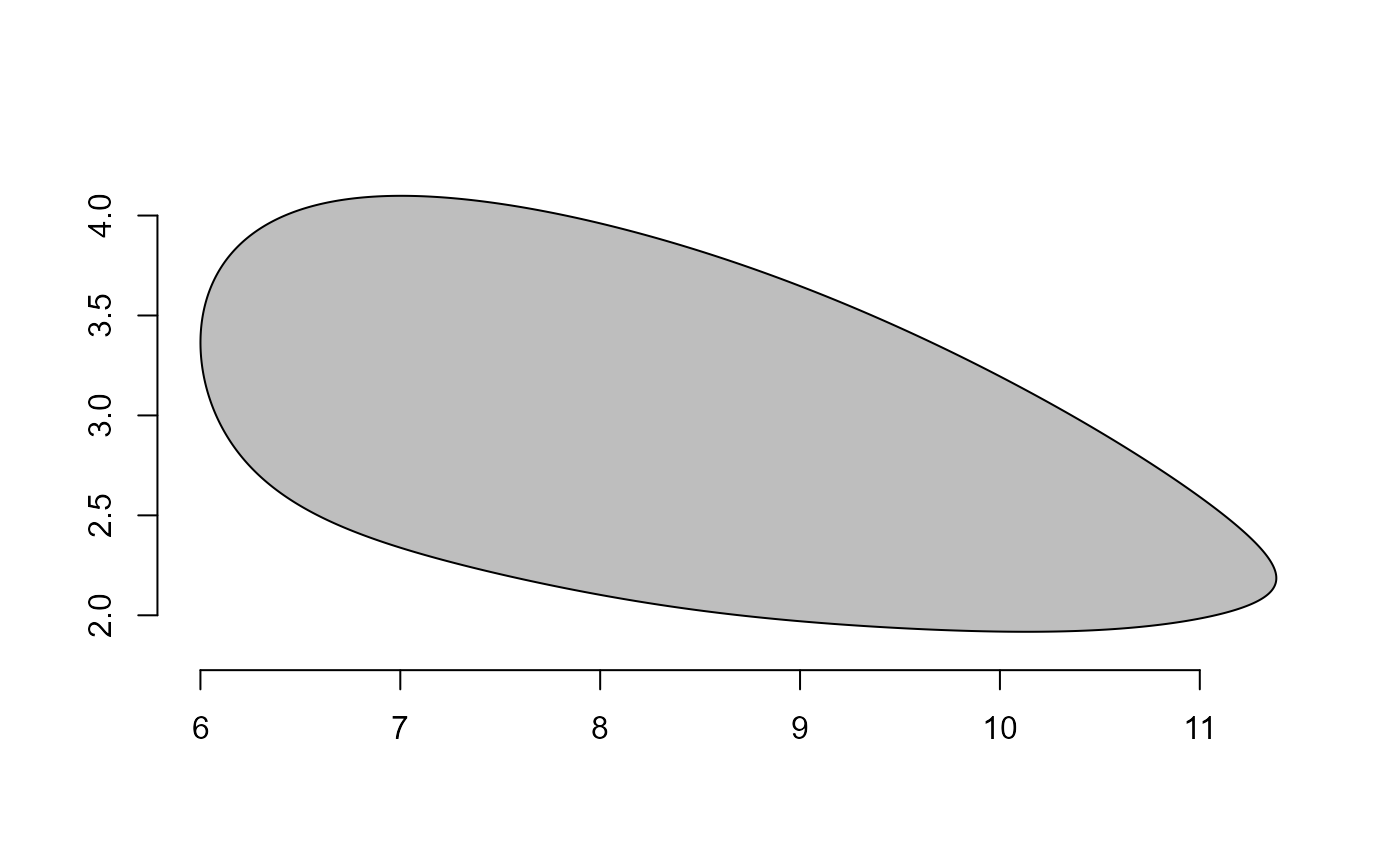
shp <- efourier_shape(npoints = 1000)

poly_pcv(shp)
#> [1] 0.0004920468

# increase the complexity of the outline
shp2 <- poly_jitter(shp, noise_x = 20, noise_y = 250, plot = TRUE)

smo <- poly_smooth(shp2, niter = 100, plot = FALSE)
plot_contour(smo, col = "red")

poly_pcv(shp2)
#> [1] 0.0094337
