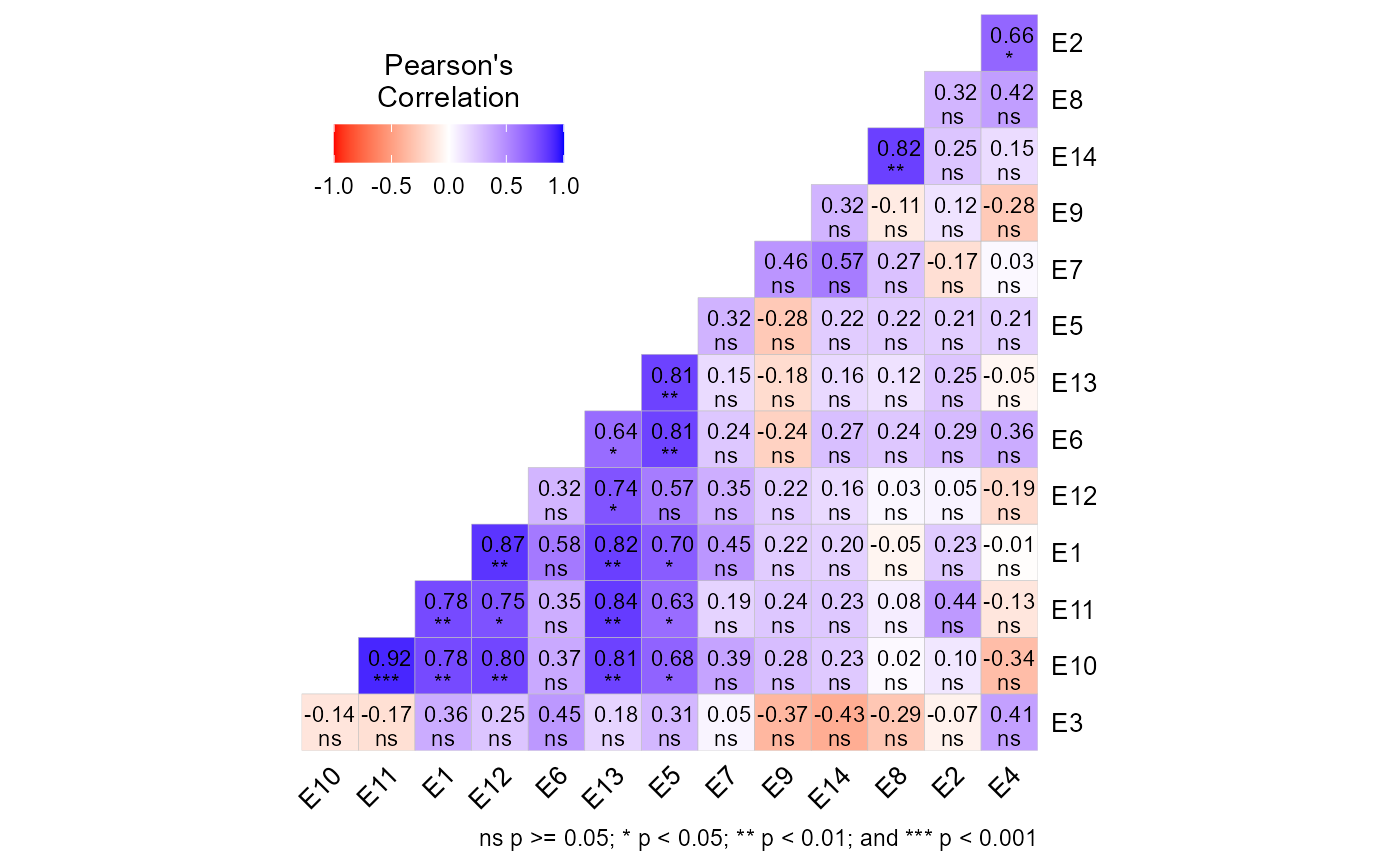
This function plots the correlation between environments generated with
env_stratification()
Usage
# S3 method for env_stratification
plot(x, var = 1, ...)
Arguments
- x
An object of class
env_stratification- var
The variable to plot. Defaults to
var = 1the first variable ofx.- ...
Further arguments passed to
plot.corr_coef()
Author
Tiago Olivoto tiagoolivoto@gmail.com
Examples
# \donttest{
library(metan)
model <-
env_stratification(data_ge,
                   env = ENV,
                   gen = GEN,
                   resp = GY)
plot(model)

# }
# }