07: Diversidade genética entre acessos de linho (Linum usitatissimum, L.) baseada em caracteres morfoagronômicos
1 Libraries
To reproduce the examples of this material, the R packages the following packages are needed.
2 Data
df <-
  import("data/data_mgidi.csv") |>
  remove_rows_na()
3 Adjust by season effect
df_man <-
  df |>
  remove_cols(gen)

mod <- manova(cbind(ac, ap, nc, ng, areac,  nr, mc, rgpla, icc, ngcap, mmg) ~ epoca,
              data = df_man)
coefficients(mod)
##                    ac         ap        nc         ng       areac         nr
## (Intercept) 53.989394  81.545455  33.51515  216.07576  0.39426566  1.2878788
## epocaE2     -2.636453  -5.016043 -10.20143  -76.07576 -0.01735562 -0.8368984
## epocaE3     10.352914   0.198007 -17.49592 -135.71037 -0.05770728 -0.7301865
## epocaE4      5.143333 -12.112727 -18.18788 -146.29394 -0.11073884 -0.8696970
##                     mc      rgpla         icc      ngcap        mmg
## (Intercept)  1.6351515  1.2174242  0.80009953  6.4669836  5.5972761
## epocaE2     -0.5247594 -0.4180125 -0.06885532 -0.2516304  0.2900347
## epocaE3     -1.1145746 -0.9076166 -0.21017662 -1.5260380 -1.7910373
## epocaE4     -1.2189697 -0.9523333 -0.16804186 -1.9838140 -1.7085045
df_resi <-
  residuals(mod) |>
  as.data.frame() |>
  mutate(gen = df$gen) |>
  column_to_rownames("gen")
4 Distances
dists <- clustering(df_resi,
                    scale = TRUE,
                    clustmethod = "average",
                    nclust = 16)

fviz_dend(dists$hc,
          k = 16,
          cex = 0.5,
          repel = TRUE,
          type = "circular") +
  theme_void()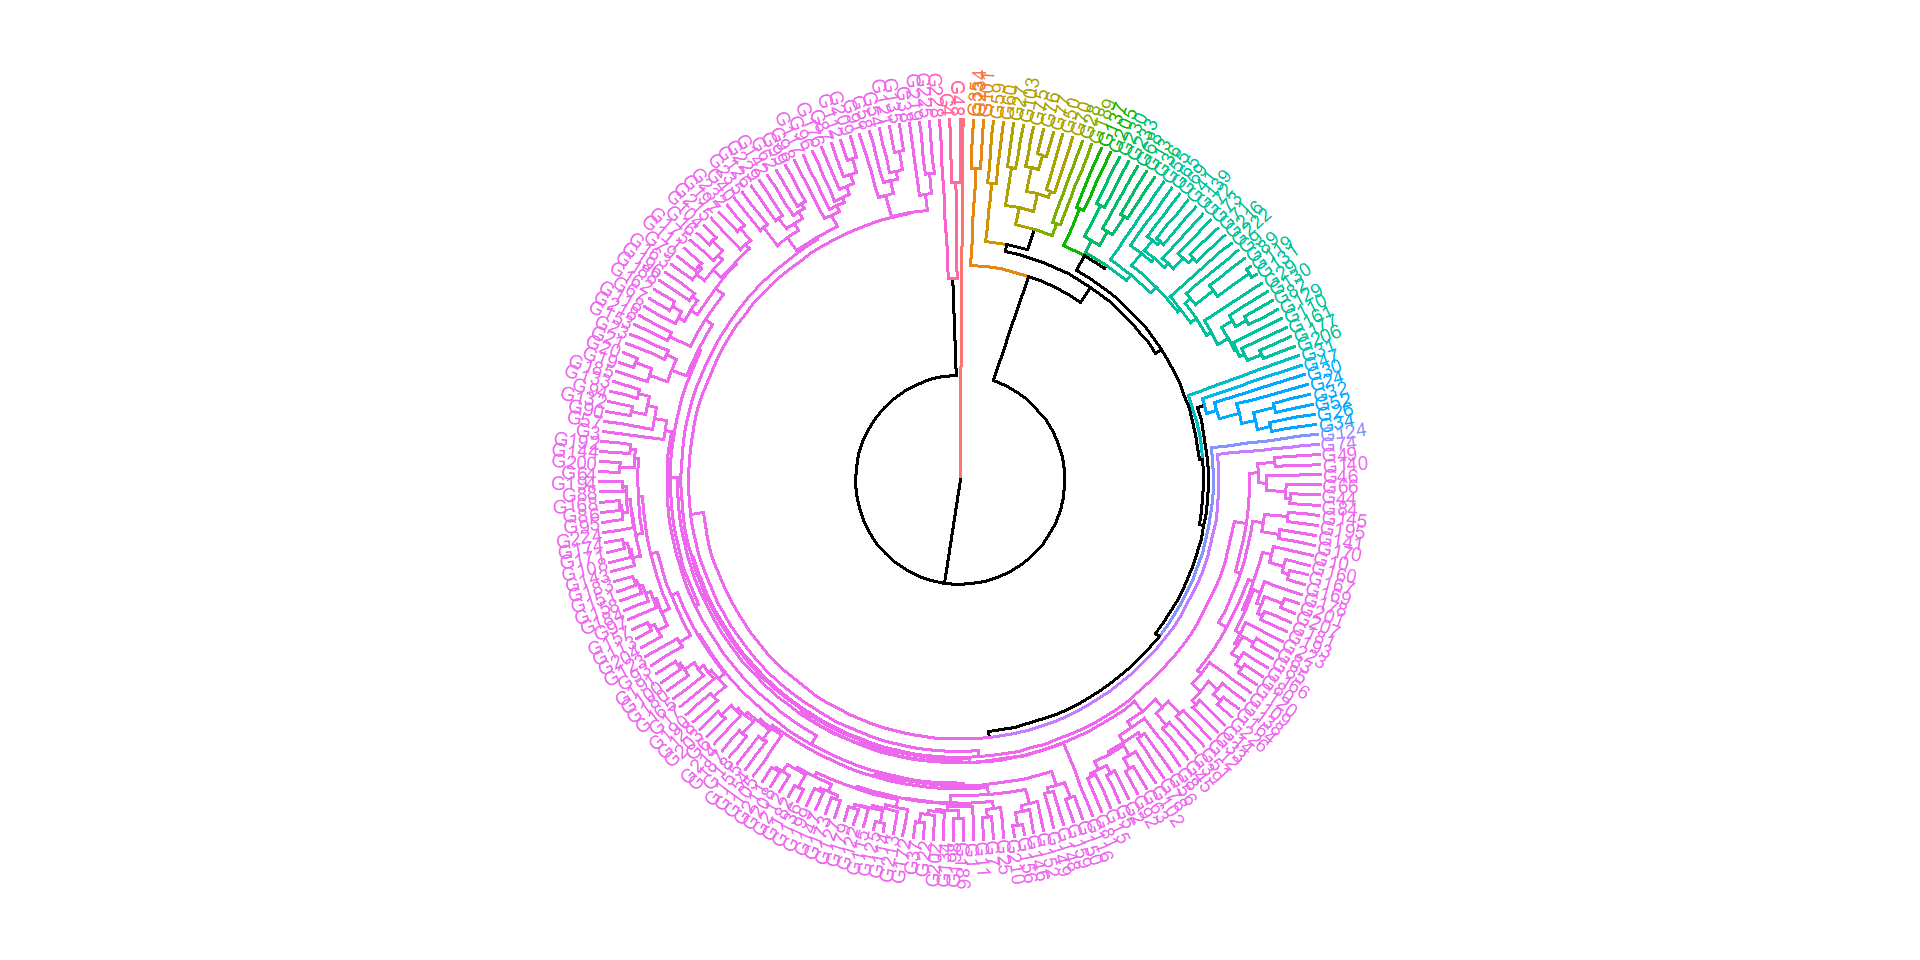
ggsave("figs/phylo.jpg",
       dpi = 600,
       width = 10,
       height = 10)
5 Médias
df2 <-
  df |>
  mutate(groups = dists$data |> pull(groups)) |>
  as_factor(groups)

df3 <-
  df2 |>
  select(groups, mmg, rgpla, ng) |>
  pivot_longer(-groups) |>
  filter(groups %in% c(2, 3, 4, 11, 15)) |>
  group_by(groups, name) |>
  summarise(mean = mean(value),
            sd = sd(value),
            n = n(),
            se = sd / sqrt(n))

df_mean <-
  df |>
  mean_by(.vars = c(mmg, rgpla, ng)) |>
  pivot_longer(everything())

df_meansel <-
  df3 |>
  mean_by(name)
6 Stats
ggplot(df3, aes(x = groups, y = mean, fill = groups)) +
  geom_col() +
  geom_hline(data = df_mean,
             aes(yintercept = value),
             linetype = 3,
             linewidth = 1) +
  geom_hline(data = df_meansel,
             aes(yintercept = mean),
             linetype = 8,
             color = "blue",
             linewidth = 1) +
  geom_errorbar(aes(ymin = mean - se,
                    ymax = mean + se),
                width = 0.2) +
  facet_wrap(~name, scales = "free") +
  theme_bw(base_size = 18) +
  theme(legend.position = "bottom") +
  scale_y_continuous(expand = expansion(c(0, 0.1))) +
  geom_text(aes(y = 0, label = glue::glue("n = {n}")),
            vjust = -1) +
  labs(x = "Grupos",
       y = "Valor médio do caractere",
       fill = "Grupos")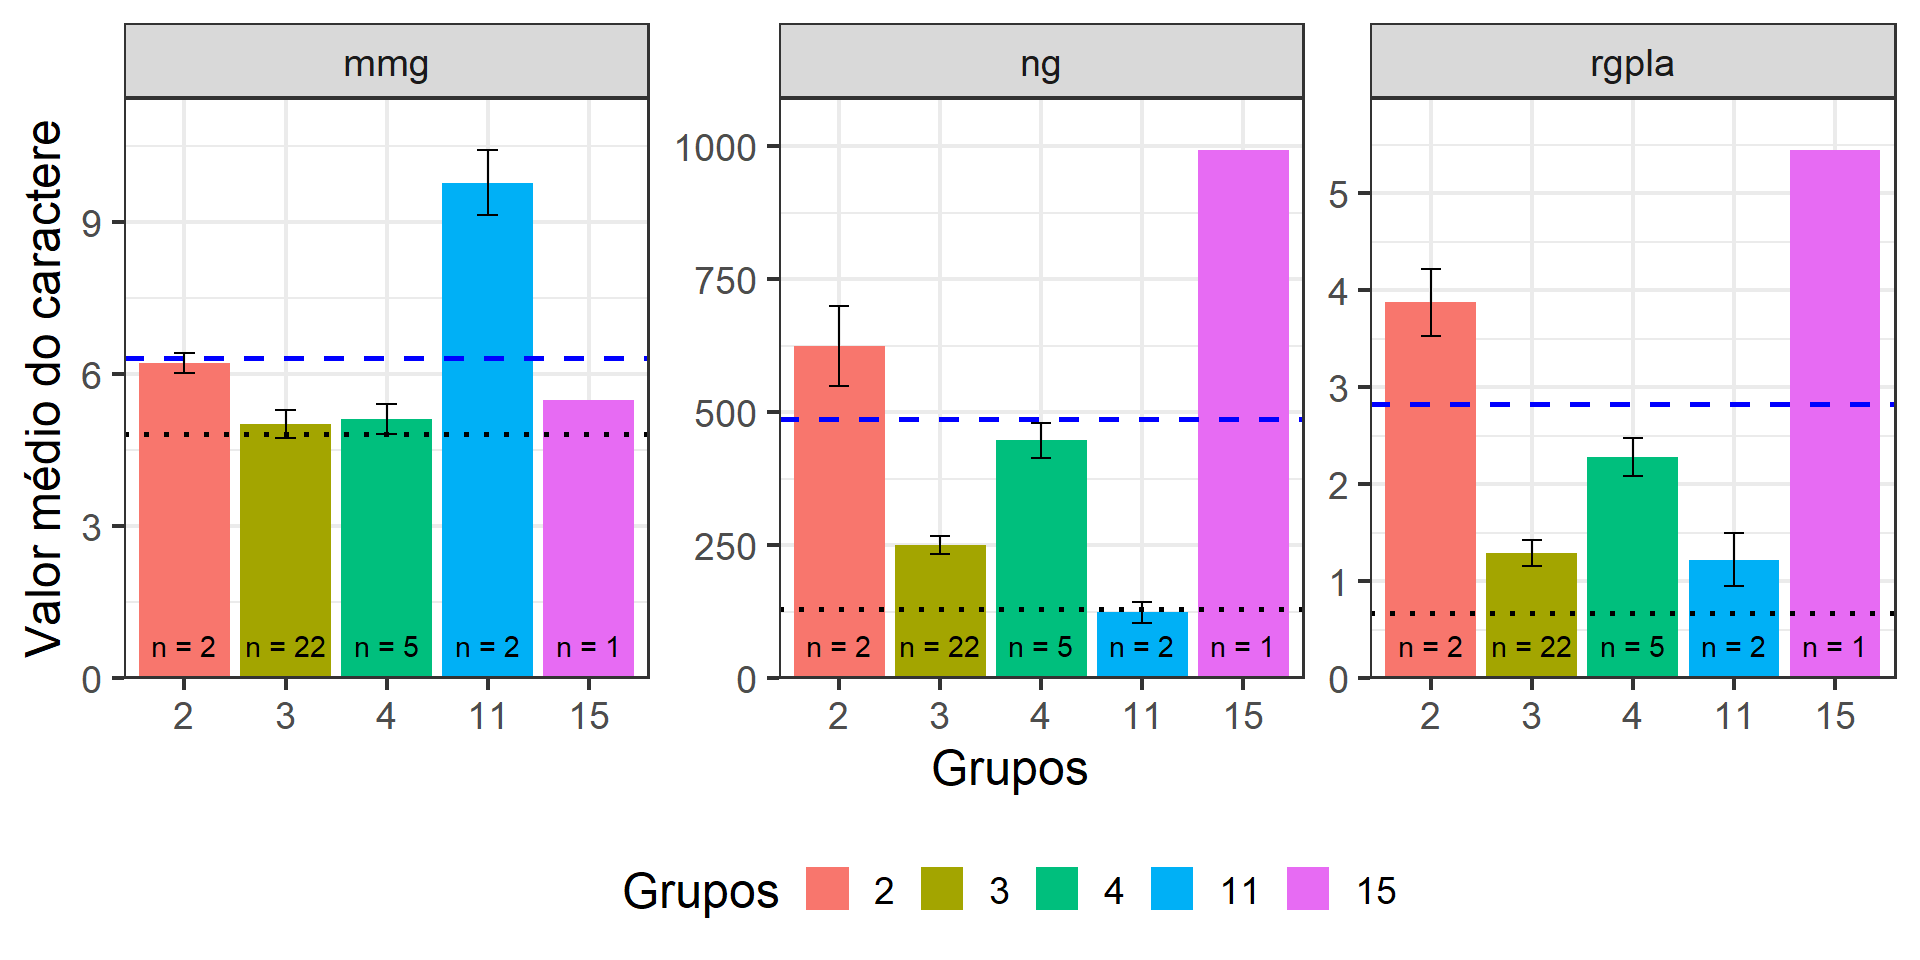
ggsave("figs/mean_clusters.jpg",
       dpi = 600,
       width = 12,
       height = 6)
7 Section info
sessionInfo()
## R version 4.2.2 (2022-10-31 ucrt)
## Platform: x86_64-w64-mingw32/x64 (64-bit)
## Running under: Windows 10 x64 (build 22621)
##
## Matrix products: default
##
## locale:
## [1] LC_COLLATE=Portuguese_Brazil.utf8  LC_CTYPE=Portuguese_Brazil.utf8
## [3] LC_MONETARY=Portuguese_Brazil.utf8 LC_NUMERIC=C
## [5] LC_TIME=Portuguese_Brazil.utf8
##
## attached base packages:
## [1] stats     graphics  grDevices utils     datasets  methods   base
##
## other attached packages:
##  [1] ggstatsplot_0.11.1 factoextra_1.0.7   metan_1.18.0       lubridate_1.9.2
##  [5] forcats_1.0.0      stringr_1.5.0      dplyr_1.1.2        purrr_1.0.1
##  [9] readr_2.1.4        tidyr_1.3.0        tibble_3.2.1       ggplot2_3.4.2
## [13] tidyverse_2.0.0    rio_0.5.29
##
## loaded via a namespace (and not attached):
##   [1] TH.data_1.1-2          minqa_1.2.5            colorspace_2.1-0
##   [4] ggsignif_0.6.4         estimability_1.4.1     parameters_0.21.1
##   [7] rstudioapi_0.15.0      ggpubr_0.6.0           farver_2.1.1
##  [10] ggrepel_0.9.3          fansi_1.0.4            mvtnorm_1.2-2
##  [13] mathjaxr_1.6-0         codetools_0.2-18       splines_4.2.2
##  [16] knitr_1.43             polyclip_1.10-4        zeallot_0.1.0
##  [19] jsonlite_1.8.7         nloptr_2.0.3           broom_1.0.5
##  [22] ggforce_0.4.1          compiler_4.2.2         emmeans_1.8.7
##  [25] backports_1.4.1        Matrix_1.6-0           fastmap_1.1.1
##  [28] cli_3.6.1              tweenr_2.0.2           htmltools_0.5.5
##  [31] tools_4.2.2            lmerTest_3.1-3         coda_0.19-4
##  [34] gtable_0.3.3           glue_1.6.2             Rcpp_1.0.11
##  [37] carData_3.0-5          cellranger_1.1.0       vctrs_0.6.3
##  [40] nlme_3.1-160           insight_0.19.3         xfun_0.39
##  [43] openxlsx_4.2.5.2       lme4_1.1-34            timechange_0.2.0
##  [46] lifecycle_1.0.3        rstatix_0.7.2          dendextend_1.17.1
##  [49] MASS_7.3-60            zoo_1.8-12             scales_1.2.1
##  [52] ragg_1.2.5             hms_1.1.3              sandwich_3.0-2
##  [55] rematch2_2.1.2         RColorBrewer_1.1-3     yaml_2.3.7
##  [58] curl_5.0.1             gridExtra_2.3          reshape_0.8.9
##  [61] stringi_1.7.12         paletteer_1.5.0        bayestestR_0.13.1
##  [64] boot_1.3-28            zip_2.3.0              systemfonts_1.0.4
##  [67] rlang_1.1.1            pkgconfig_2.0.3        evaluate_0.21
##  [70] lattice_0.20-45        patchwork_1.1.2        htmlwidgets_1.6.2
##  [73] labeling_0.4.2         tidyselect_1.2.0       GGally_2.1.2
##  [76] plyr_1.8.8             magrittr_2.0.3         R6_2.5.1
##  [79] generics_0.1.3         multcomp_1.4-25        pillar_1.9.0
##  [82] haven_2.5.3            foreign_0.8-83         withr_2.5.0
##  [85] survival_3.4-0         datawizard_0.8.0       abind_1.4-5
##  [88] car_3.1-2              utf8_1.2.3             correlation_0.8.4
##  [91] tzdb_0.4.0             rmarkdown_2.23         viridis_0.6.3
##  [94] grid_4.2.2             readxl_1.4.3           data.table_1.14.8
##  [97] digest_0.6.33          xtable_1.8-4           numDeriv_2016.8-1.1
## [100] textshaping_0.3.6      statsExpressions_1.5.1 munsell_0.5.0
## [103] viridisLite_0.4.2